As fourth quarter earnings season gets underway, investor attention is again split between earnings expectations and reported realities. Earnings estimates for 2026 point to another great year, but valuation metrics and recent relative performance tell a more nuanced story across the small, mid, and large cap equities. Let’s explore.
Although final fourth quarter earnings results will be announced over the next several weeks, examining 2026 earnings expectations relative to full-year 2025 results provides clarity on the recent relative performance we’ve seen across various segments of the equity market.
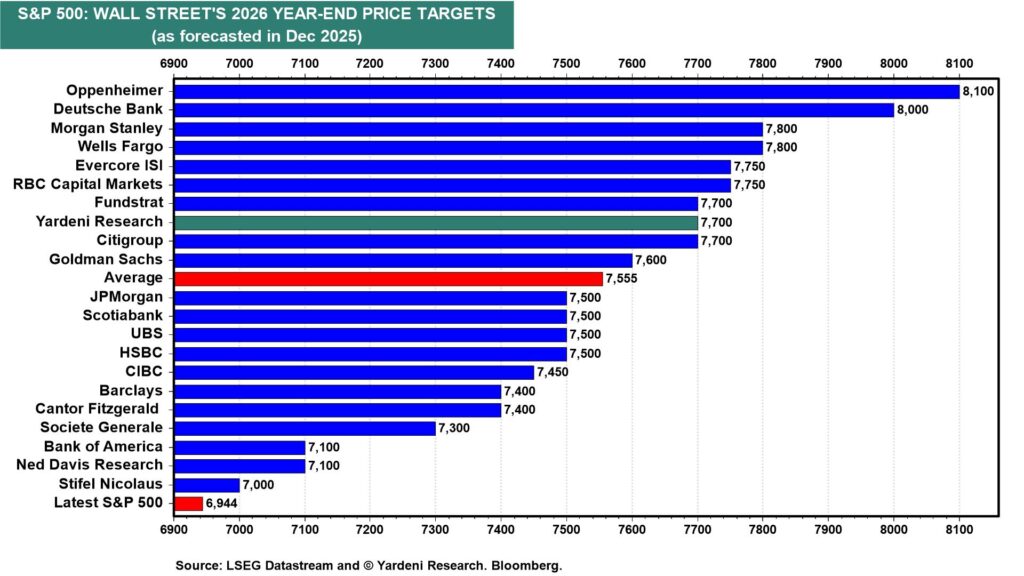
Overall, analysts are forecasting S&P500 earnings growth of 15% in 2026, well above the trailing 10-year average growth rate of 8.6%. In response, market forecasters have published their year-end 2026 targets for the S&P 500, with consensus expectations near 7,555, implying a roughly 10% return for the index this year.
Looking beneath the surface, earnings for the Magnificent 7 are expected to grow by 22.7% in 2026, in line with their estimated 22.3% growth in 2025. Meanwhile, analysts project the remaining 493 companies will generate 12.5% earnings growth for 2026, well above the estimated 9.4% growth for 2025. The difference lies not in the nominal number, but the pace of change in the growth itself. Advantage to the 493. As it stands, earnings for the 493 are set to accelerate by 33% versus 1.8% for the Mag 7:

It’s a significant trend and it is already appearing in market performance. The chart below highlights trailing 1, 3, and 6-month returns of large, mid, and small cap US equity indices illustrating the growing participation beyond the largest companies.

While calendar year performance is one way to measure results, investment cycles rarely move on a set schedule. This serves as a healthy reminder to investors that maintaining a broadly diversified equity allocation across market capitalizations is important to portfolio resilience and long-term financial plans.
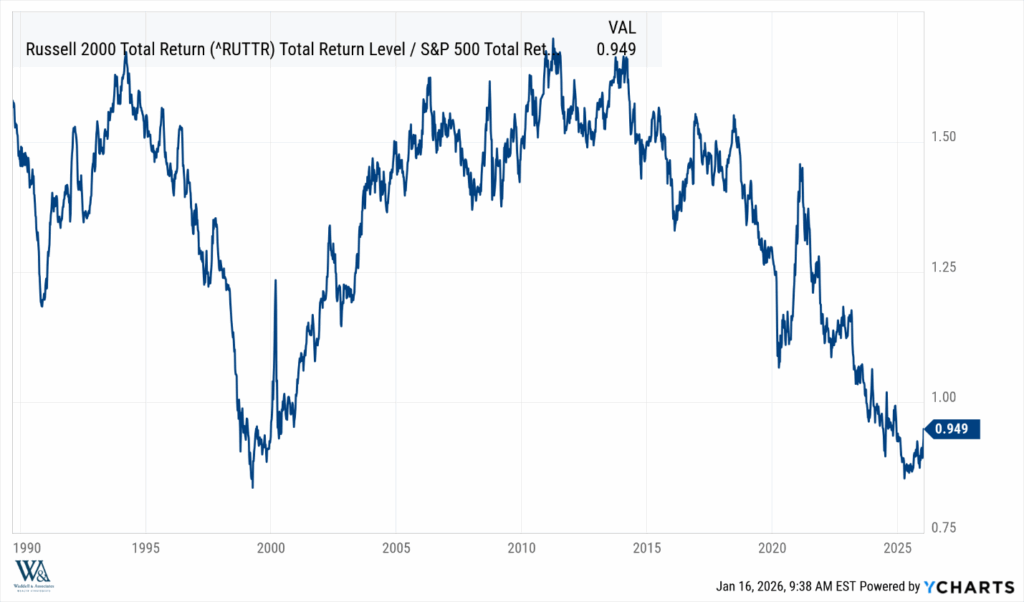
To that point, consider the following chart, which illustrates the relative performance ratio of the Russell 2000 and S&P500 total return dating back to 1989. As the indices move in relative performance, so does the line. As illustrated, the Russell 2000 enjoyed significant outperformance from about 2000-2010 but has lagged since 2021. However, this suggests the tide is turning, and history shows these cycles often have further room to run!
Happy Martin Luther King Jr. Day, and have a great week!
-Matt
Sources: Yardeni Research, Factset, Ycharts
This communication and its contents are for informational and educational purposes only and should not be used as the sole basis for any investment decision. The information contained herein is based on publicly available sources believed to be reliable but is not a representation, expressed or implied, as to the accuracy, completeness, or correctness of said information. References to political figures or policies are for informational purposes only and do not represent an endorsement by Waddell & Associates. Any forward-looking statements reflect current opinions and assumptions and are subject to change without notice; actual results may differ materially. Past performance does not guarantee future results. Waddell & Associates may use artificial intelligence tools to help generate or summarize content; all outputs are reviewed by our team for accuracy and relevance.