The Fed convened last week and cut base interest rate policy by 0.25%. In the press conference that followed, Fed Chair Jerome Powell described this as a “Risk Management Cut.”
In the investment world, “risk management” is a familiar phrase, and with Powell’s background, he surely understands it well. But what exactly are the risks of raising, holding, or cutting interest rates, and what is the appropriate path of monetary policy given the data at hand?
With recent revisions in employment data and tone surrounding this rate cut, the Fed appears to be shifting the balance of its dual mandate more towards maximum employment than price stability. Powell has repeatedly emphasized that this Fed is data dependent. So, what does the data actually show, and is there cause for rising economic risk? Let’s tour a few government offices and see what their data had to say last week!
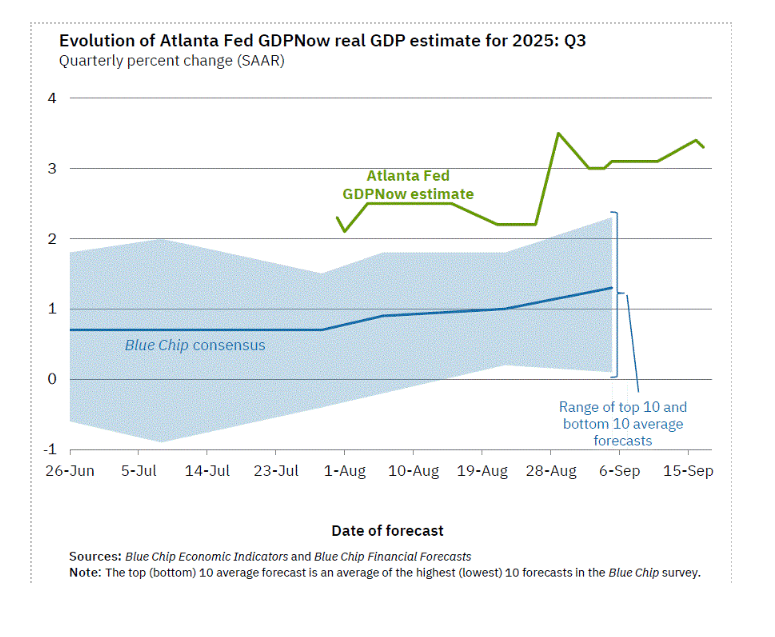
First Stop: Atlanta
The Atlanta office of the Federal Reserve produces a “GDPNow” forecasting model. It provides a “nowcast” of the official estimate of GDP. It estimates growth using a methodology similar to the official one used by the US Bureau of Economic Analysis. Last week, the latest release estimated 2025 GDP growth at 3.3%, well above long-run potential growth of 1.8%.
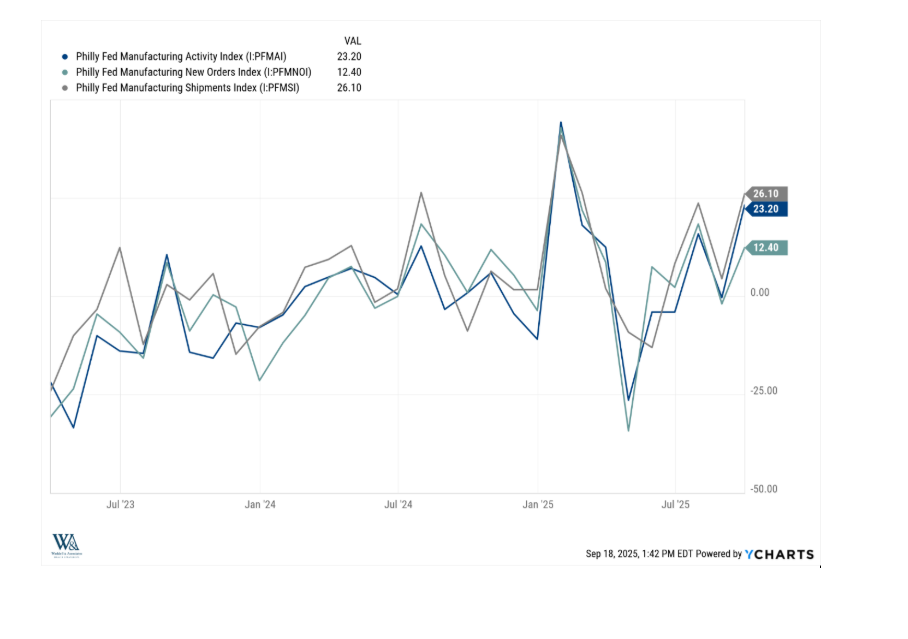
Next Stop: Philly
The Philadelphia office of the Fed conducts a monthly manufacturing business survey. While not a nationwide survey, its local scope often makes it a reliable, real-time signal. September’s results indicated regional manufacturing activity expanded. Indicators for activity, new orders, and shipments all rose month over month and have been in a relative uptrend since mid-2022.
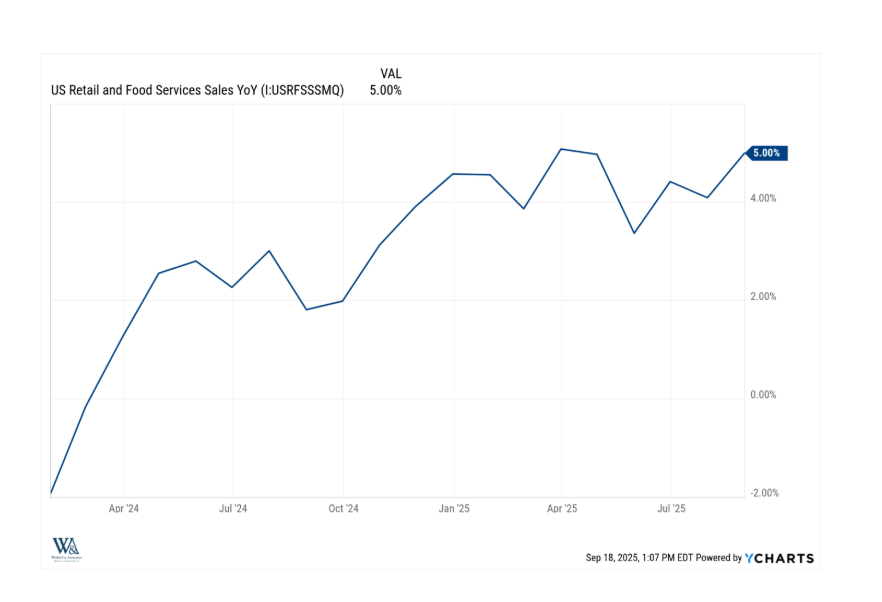
Next stop: Washington, D.C.
The US Census Bureau released advanced monthly sales for retail and food last week. Investor and consumer spending accounts for over 70% of US GDP. Incrementally, spending increased month over month and now sits 5% higher year-over-year, and it too remains in a relative uptrend.
Last Stop… The Federal Reserve
Once a quarter, the Federal Reserve releases its Summary of Economic Projections (SEP). This report contains FOMC member projections for the unemployment rate, inflation, and GDP. It provides a median forecast of the members which serves as a guide for projected path of monetary policy. This quarter, you’ll see that FOMC members increased their GDP projections, decreased their unemployment projections, and mostly held their inflation estimates in line.
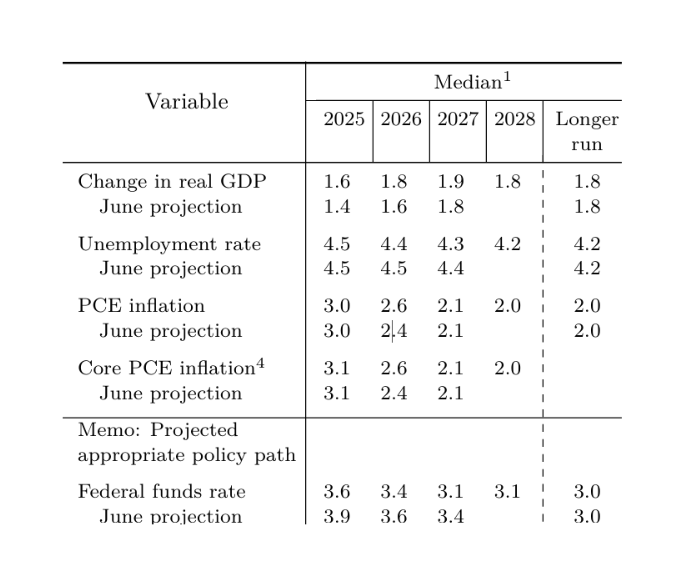
Of course, Powell would tell you these numbers are not predictions, more suggestions as to the appropriate path of monetary policy alongside the dual mandate of price stability and maximum employment.
In the end, Powell may frame the latest rate cut as a matter of “risk management”, but the Fed’s own projections and last week’s data tell a different story. Strong GDP growth, improving manufacturing data, and a spending consumer make this economy healthier than they think!
That’s all for this week!
-Matt
Sources: YCharts, Federal Reserve Bank of Philadelphia, Federal Reserve Bank of Atlanta, Federal Open Market Committee Summary of Economic Projections
This communication and its contents are for informational and educational purposes only and should not be used as the sole basis for any investment decision. The information contained herein is based on publicly available sources believed to be reliable but is not a representation, expressed or implied, as to the accuracy, completeness, or correctness of said information. References to political figures or policies are for informational purposes only and do not represent an endorsement by Waddell & Associates. Any forward-looking statements reflect current opinions and assumptions and are subject to change without notice; actual results may differ materially. Past performance does not guarantee future results. Waddell & Associates may use artificial intelligence tools to help generate or summarize content; all outputs are reviewed by our team for accuracy and relevance.