Periodically, and currently, markets seem disoriented. Soft economic data pairs poorly with small cap outperformance. Higher inflation readings pair poorly with lower rates. US currency strength pairs poorly with US large cap outperformance. When crosscurrents and unusual pairings upend expectations, strategists must re-examine market vitals to identify the root cause of the chaos. Herein lies this week’s assignment.
Economic Growth?
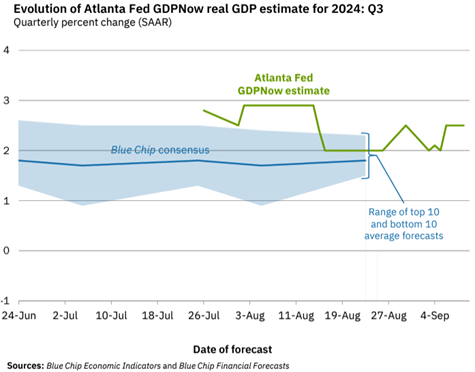
The US economy grew 2.3% in the first half of 2023 driven by solid growth in labor productivity. Currently, the Fed’s GDPNow measure predicts 2.5% growth in the third quarter, up from 2.0% before the stronger-than-reported August jobs report. More forward-looking measures like housing activity and purchasing manager indices suggest a lower final reading, but nothing in the data suggests an imminent recession.
Earnings Growth?
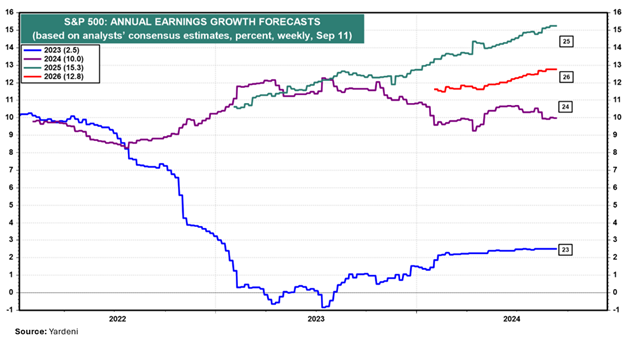
S&P 500 earnings grew 11.3% within the second quarter, with 80% of reporting companies beating analyst expectations. Analysts see a deceleration in earnings growth within the third quarter to 5% but a reacceleration in the 4th quarter to 14%. Expectations for all of 2024 have remained resilient at 10%, while opinions on future earnings have continuously improved, with 15% growth expected in 2025 and 13% expected in 2026.
Inflation?
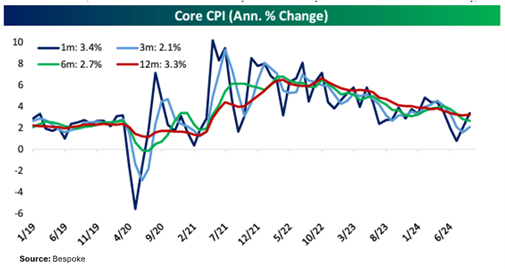
The August CPI inflation report came in incrementally higher and hotter than expected, but a detailed review reveals little evidence of durable reinflation. Note the trends below. Despite August’s puzzling advance (solely driven by housing, airline, and hotel rates), annualized inflation rates over the last 12 months stand at 3.3%, 6 months at 2.7%, and 3 months at 2.1%. Clearly, these longer-term measures depict an irrefutable disinflationary trend:
Fed Policy?
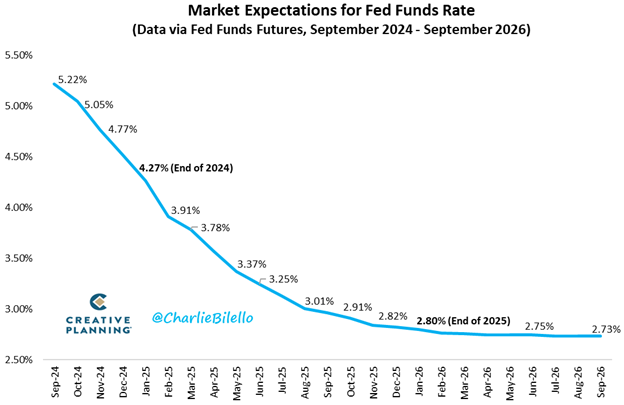
Chairman Powell made it quite clear that the Fed will cut interest rates next week. The Fed has also published its “neutral” Fed Funds rate of 3%. With the Fed Funds at 5.5% currently, this implies 2.5% of upcoming rate cuts. Fed Funds futures predict that the Fed will cut by .25% next week. We would prefer a .50% cut to kick things off, but recent economic data along with the backward-looking, incremental nature of the FOMC, makes .25% more likely. However, markets do anticipate a full 1% in cuts before the end of the year. With only three meetings remaining that makes one of the cuts a double at .50%. By year end 2025, the market expects the Fed will have completed its rate reduction cycle.
Investor Sentiment?
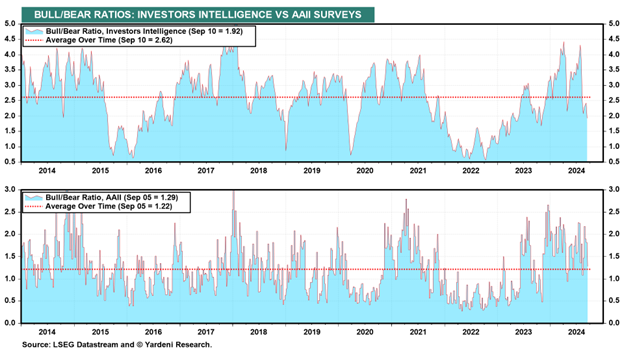
Investor sentiment levels can often distort market movements as positive economic, earnings, inflation, and interest rate readings fall short of overblown expectations. Given the positive stack of conditions above, lofty sentiment levels might explain lagging returns. However, professional and household investor sentiment levels currently read lukewarm rather than white hot:
The Search Continues
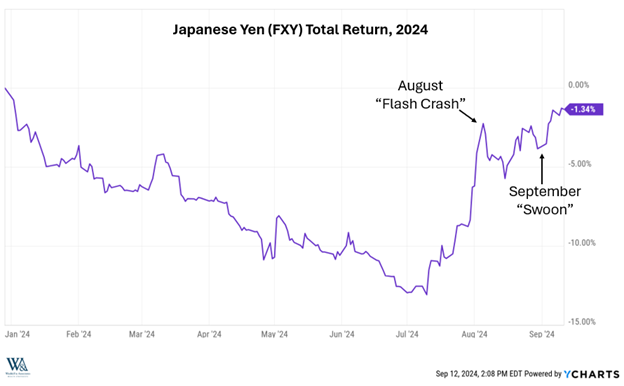
Typically, mixing resilient GDP growth, rising earnings expectations, falling inflation rates, Fed rate cuts, and neutral investor sentiment would send stocks higher. However, since reaching 5,670 on July 17th, stocks have languished and appeared conviction-less. Clearly, something atypical has distracted traders and their algorithms. Perhaps, it’s time we revisit the carry trade. Recall that back in early August, a rapid strengthening of the Japanese Yen resulted in a “flash crash” in the Magnificent 7 and stocks overall. This relationship between an upward thrust in the Yen and a downward thrust in stocks became hardcoded in the market’s algorithms. In response to the August “flash crash”, the Bank of Japan softened their monetary stance which enabled a decline in the Yen and a stock market recovery. However, the Yen quietly resumed its ascent in early September again pressuring stocks in a September “swoon”:
It is this push and pull in the Yen that has directed the push and pull in the market, despite the favorable fundamentals profiled above:
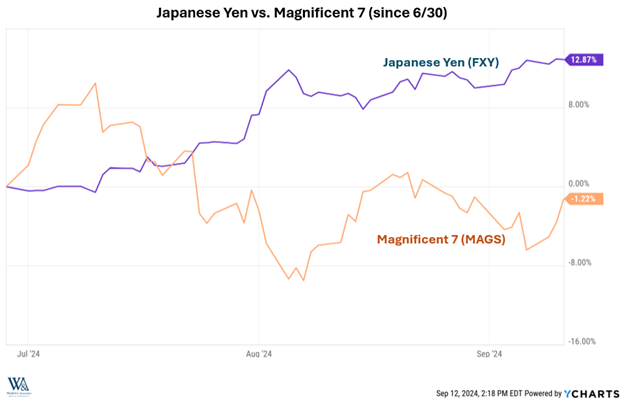
However, as the Yen carry trade unwinds, markets will become less influenced by currency gyrations. Attention will return to more traditional drivers such as resilient GDP growth, rising earnings expectations, falling inflation rates, Fed rate cuts, and neutral investor sentiment. Absent a significant Fed policy mistake, we expect the Yen’s influence will fade, fundamentals will reassert themselves and the rally will resume into year end.
Have a great week!
-David
Sources: Blue Chip Economic Indicators and Blue Chip Financial Forecasts, @Yardeni Research, Bespoke, Creative Planning, LSEG Datastream, Y Charts
This communication and its contents are for informational and educational purposes only and should not be used as the sole basis for any investment decision. The information contained herein is based on publicly available sources believed to be reliable but is not a representation, expressed or implied, as to the accuracy, completeness, or correctness of said information. Past performance does not guarantee future results.