As a Philadelphia Philles baseball fan, I often spend late August dreaming of “Red October”. With 162 games played in a season, baseball is an endurance sport. Only one month remains in the season, and postseason success depends heavily upon momentum entering the playoffs. To evaluate the quality of a team’s momentum, fans analyze each game’s box score which tallies the performance statistics of each individual player. Entering October, fans might want to see rising trends in batting average, home runs, or even walks depending on the player. To illustrate the matrix, here is a superlative box score from a Phillies Mariners game this week:

For Phillies fans, 20 hits on 41 at bats with 11 runs spread across the roster bodes well for post-season aspirations. But momentum can change on a dime and shifts often appear in the box score before they appear on the scoreboard. For investors, the same framework applies. The stock market has its own daily box score, and momentum shifts often carry greater meaning. Over the past month, momentum trends within the market have changed. Whether these shifts will threaten or support investors returns into year end remains to be seen, but it pays to do the analysis and consider year-end rostering.
The Investment Style Box
Morningstar created stock market style box analysis in the late 90’s to help investors understand an investment manager’s strategy. The matrix contains 9 boxes. The vertical axis groups stocks by size; (market capitalization) small, medium, or large. The horizontal axis groups stocks by style; value, blend or growth. Here is the theory illustration provided by Christine Benz in 1992:
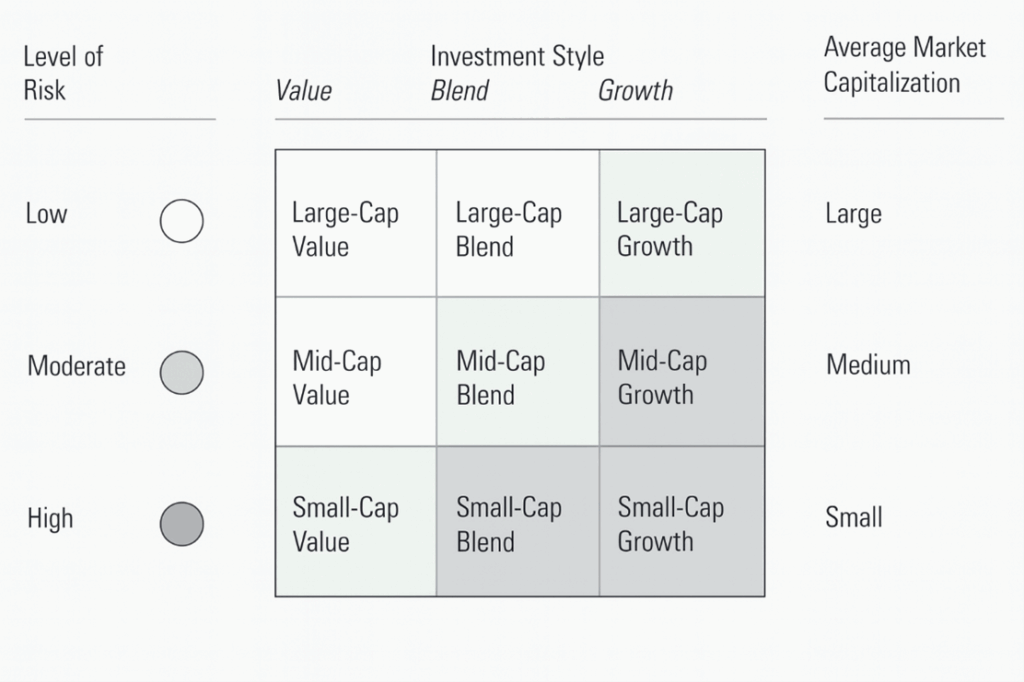
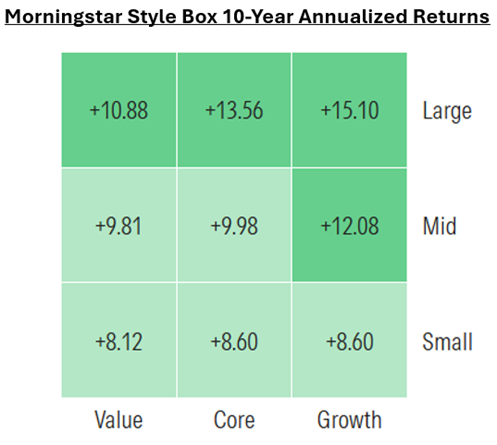
At the time, active money managers managed most investor assets by picking stocks. This grid allowed investors in mutual funds to decode portfolios and determine return drivers. Today, most investor assets are managed passively within index funds. Therefore, rather than using the style box to decode managed portfolios, investors now use the style box to construct passive portfolios. How investors move aggregate assets around the style box reveals trends. Over the last 10 years, the rise of the Mag 7 has driven return differentials for the Large Cap Growth box to historic levels comparable to the 1990s:
But this run didn’t occur without interruption, the following chart details Large Cap Growth style box drawdowns over the past 5 years (I included Nvidia, its leader, as well). The recession scare of 2022 drove Large Cap Growth down 33%, while Nvidia shed 66% into October. This year, the Deep Seek scare followed by the Tariff Turmoil, drove Large Cap Growth down 22% while Nvidia shed 40%.
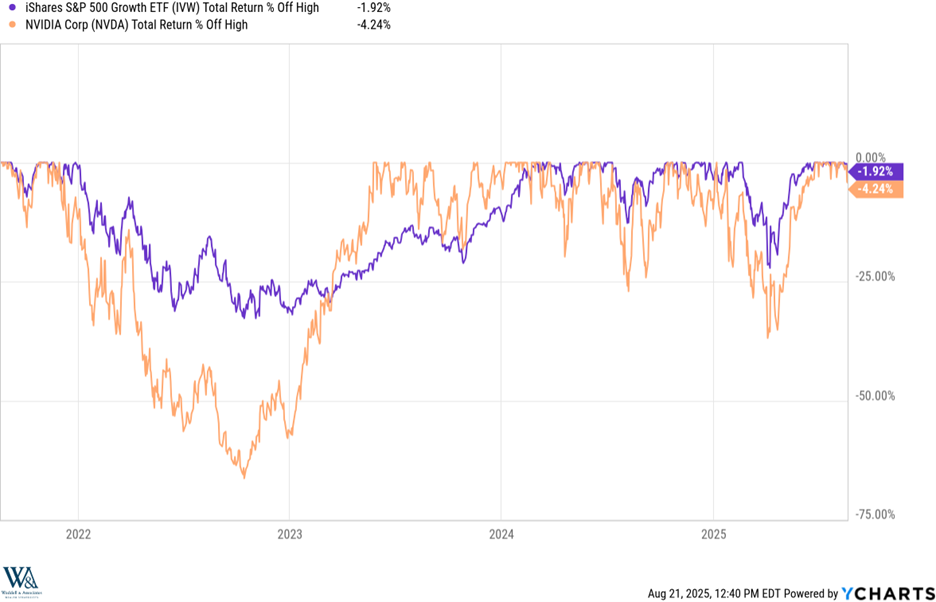
Within the last two weeks, Nvidia and its large cap tech brethren have started shedding altitude causing some to question this current break in momentum. They are right to question. Expectations for AI came under scrutiny when MIT released a report questioning its business utility and anxieties rose about Nvidia’s upcoming earnings release. Tech rallied 45% off the April lows in a straight line so some rest is well-earned. However, the selling doesn’t seem to represent selling of the market overall, just repositioning as momentum has begun appearing elsewhere:
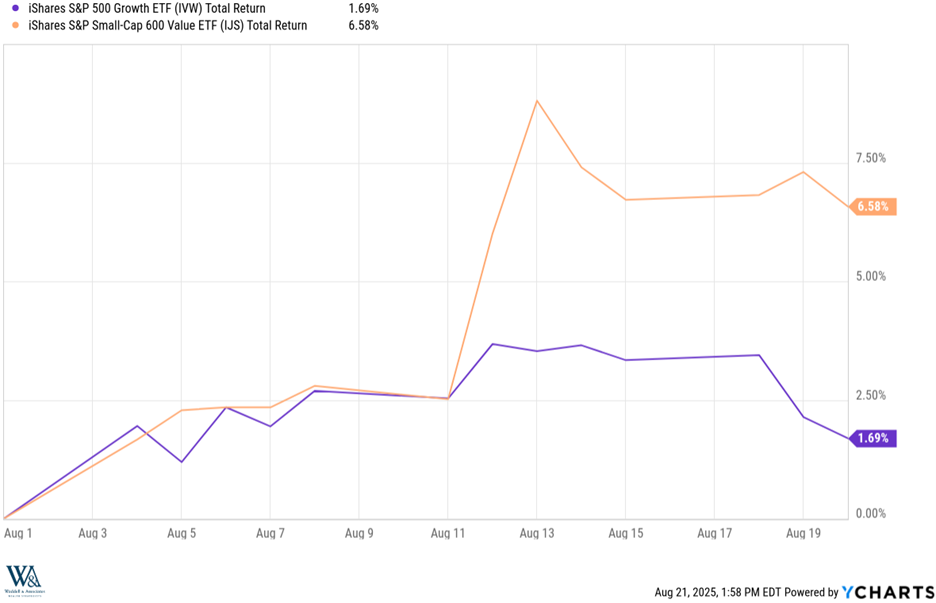
A prolonged hot streak, weak seasonals and a downbeat AI report from MIT explains the drawdown in Large Cap Growth box as shown above, but what explains the surge higher in the Small Cap Value box?
Second Half Playbook
As we discussed in our halftime report, the combination of fiscal stimulus, monetary stimulus, currency stimulus and AI Capital Expenditures stimulus will far outweigh the tariff drag, sequester recession risks, and drive stock prices higher. During the first half of 2025, earnings resiliency amidst ambiguity drove investors into the earnings juggernauts within the Large Cap Growth box. But in the second half, earnings participation should broaden out as Trumps stimulus packages bite and interest rates fall. Small companies rely much more heavily on debt than large companies, benefiting disproportionately from rate cuts. Regulatory relief reduces compliance drags and encourages mergers and acquisitions, disproportionately benefiting small companies. Policy-inspired recoveries in US manufacturing activity will also disproportionately benefit smaller cap industrial companies more than larger cap technology companies. From a valuation perspective, the Small Cap Value box trades for 15x earnings, while the Large Cap Growth box trades for 34x earnings, creating a sizable discount for the smalls. Lastly, while the Large Cap Growth box has a total market value of $40.1 trillion, the Small Cap Value box has a total market value of less than $1 trillion. It doesn’t take much of a rotation between boxes to create meaningful lift as demonstrated in the chart above. While earnings resilience gave the Large Cap Growth box advantage in the first half of the year, low valuations and interest rate cuts should give the Small Cap Value box advantage in the second half of the year. Time to sketch out year-end playbooks, evaluate your rosters, and ensure you have the right batters… in the box.
Or leave it to us. We would be happy to manage your team!
Have a great weekend!
-David
Sources: YCharts, Morningstar
This communication and its contents are for informational and educational purposes only and should not be used as the sole basis for any investment decision. The information contained herein is based on publicly available sources believed to be reliable but is not a representation, expressed or implied, as to the accuracy, completeness, or correctness of said information. References to political figures or policies are for informational purposes only and do not represent an endorsement by Waddell & Associates. Any forward-looking statements reflect current opinions and assumptions and are subject to change without notice; actual results may differ materially. Past performance does not guarantee future results. Waddell & Associates may use artificial intelligence tools to help generate or summarize content; all outputs are reviewed by our team for accuracy and relevance.