It’s July. Trump’s campaign promises have largely been fulfilled. DOGE blasted off and slashed $150 billion in expenses. Southern border encounters fell in June to 9,306 vs. 130,415 this month last year. Trump signed his $4.5 trillion OBBB on July 4th, the largest tax cut in history, and tariffs have begun pouring revenue into the US Treasury. Each of these major milestones contains intended and unintended economic consequences. Some will take time to evaluate, like the economic growth promises within the OBBB. Some have had time to simmer, like the tariff duties. This week, let’s examine the tariff digestion within the economy thus far.
The Revenues
Trump promised that tariffs would boost Federal Revenue.
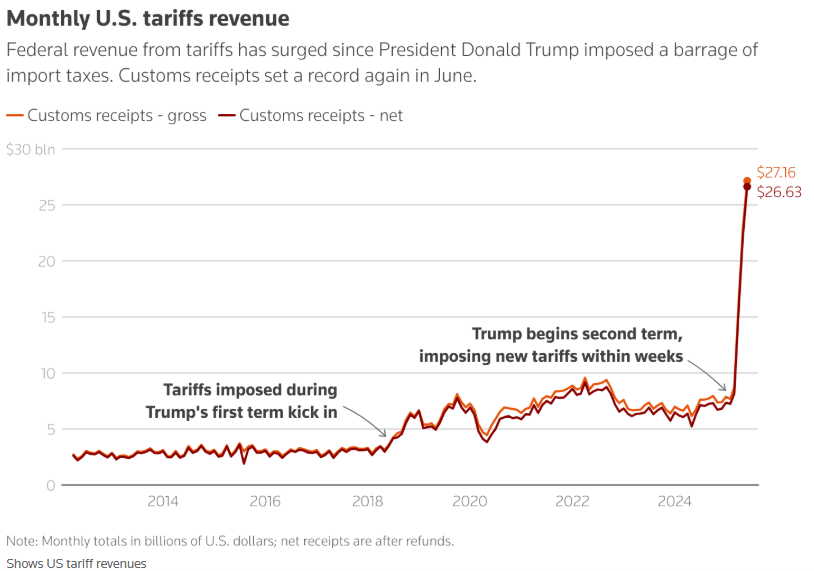
In July, the US Customs agency collected $27 billion in tariff duties on roughly $350 billion in imported goods. This equates to a roughly 8% effective rate so far, well below the “negotiating” rate currently levitating toward 20% as Trump applies maximum pressure worldwide into the August 1st deadline. It’s unclear where the rate will settle, but Treasury secretary Bessent stated recently, “we will be taking in $300 billion this year alone.” For that to be the case, let’s pick $350 billion as the anticipated take and run the numbers to calculate the post-negotiations tariff rate. For the first six months of the year, US customs collected $84 billion in tariff duties. To reach $350 billion in tariff revenues, customs would have to collect $266 billion over the remainder of the year. US imports totaled $4.1 trillion in 2024, or $340 billion per month. For 2025, imports totaled $2.3 trillion within the first six months, well above that run rate as companies front-ran the April tariffs. Assuming a $4.2 trillion total for 2025, the effective tariff rate for the back half of the year must equal 14%, 6% above current levels.
Inflationary impact
Several categories within the June CPI report reflected tariff impacts. For instance, for those of you shopping for stoves or refrigerators, I have some bad news:
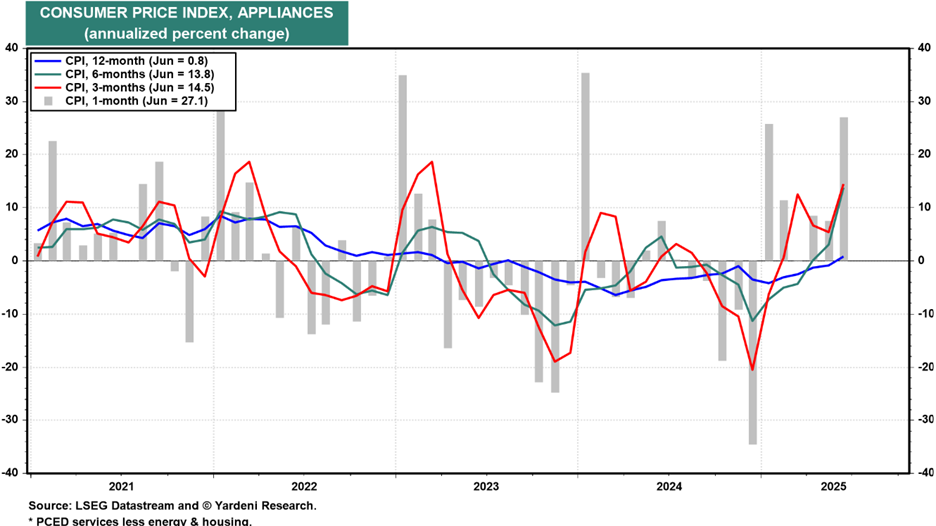
While prices for home appliances rose a mere .8% over the past year, they have risen 27% over the past month (annualized). Economists lump appliances into a category called “durable goods.” Durable goods include products with longer than 3-year life spans like cars, home furnishings, machinery, electronics, toys, tools, etc. These categories account for over 60% of overall imports and bear the brunt of the tariffs. Therefore, the best way to track the acute impact of the tariffs on inflation is to examine the inflation within the durable goods category.
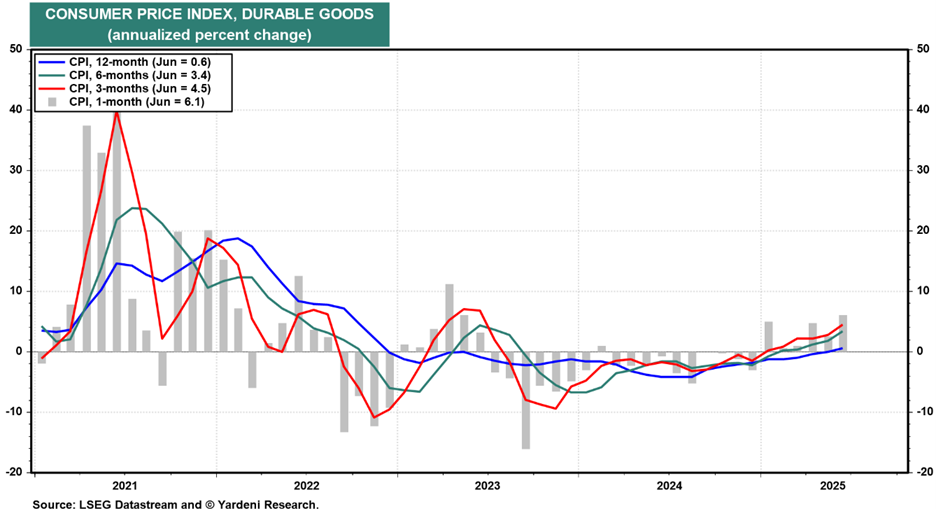
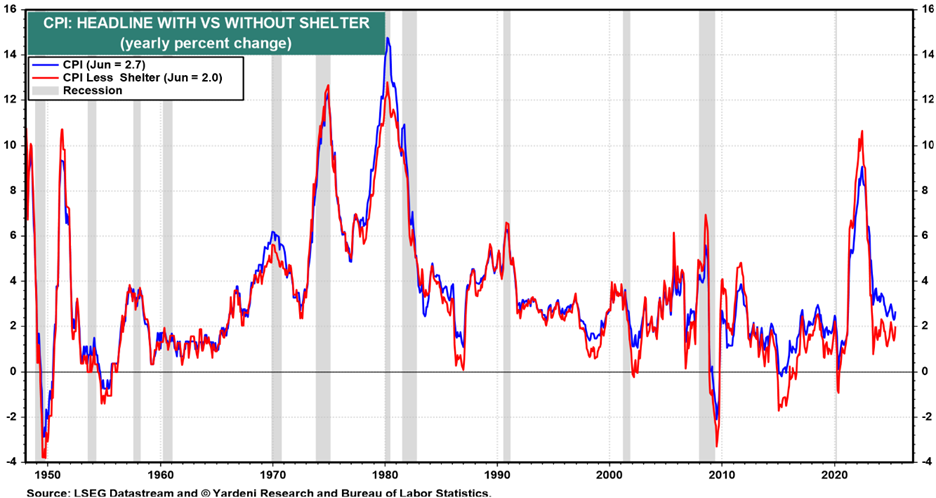
For June, durable goods inflation increased 6.1% annualized, accelerating from .6% over the past year. As you can see in the above chart, outside of the COVID distortions, durable goods prices typically deflate, which has been the primary benefit of globalization for consumers for years. Before we panic, here are two points lost in the media. First, durable goods represent less than 10% of overall US GDP. Our economy is largely domestic with services accounting for 68% of all economic activity. The COVID inflation that bit so badly wasn’t goods inflation, it was services inflation. Therefore, any decrease in services inflation will more than offset an increase in durable goods or tariff inflation. Housing costs represent the largest contributor to services inflation and roughly 34% of inflation overall. Note the current trend in housing inflation:
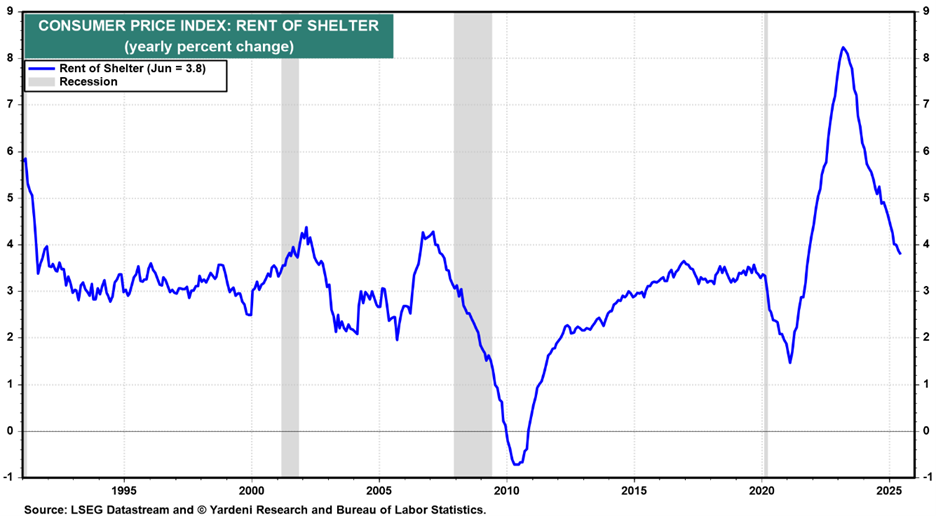
Housing’s steady trend of disinflation has provided the bulk of disinflation overall. Yet, housing inflation at 3.8% over the past year remains above the 3% pre-COVID average. If we remove shelter from the equation… the year-over-year inflation rate for the USA falls from 2.7% to 2%… spot on the Fed’s 2% target:
Lastly, a jump in the effective tariff rate from 3% to 14% creates an upward price adjustment in durable goods, but not persistent inflation. A $100 Lego Death Star could become a $111 Lego Death Star due to the 11% increase in tariffs if fully passed along, but once it does, the observable disinflationary trend should resume. In other words, there is a difference between inflation and price adjustment. The tariffs create price adjustments, not inflation. And depending on the timing of the adjustments and dynamics in housing and services inflation, they may underwhelm the excitable given their lesser weight within the economy overall. Expect price adjustments in durable goods as tariffs bite, but don’t expect them to conjure a return to COVID-like inflation.
Growth Impact
Most economists, including us, expect tariff distortions to create some GDP drag. In fact, US GDP shrank .5% in the first quarter as imports surged in anticipation of tariff impositions. With trade somewhat normalizing in the second quarter, the Fed currently estimates a GDP growth rate of 2.6%, placing GDP growth for the first half just above 1%. This registers well below the 1.9% rate the Fed espouses as our long-term potential growth rate. However, while the first quarter growth rate anticipated tariffs, the second quarter growth rate included them. Given the disproportionate share of economic activity contributed by the US consumer, changes in unemployment and disposable income (spending capacity) influence GDP far more than tariff policy. A quick check of these vitals offers encouragement:
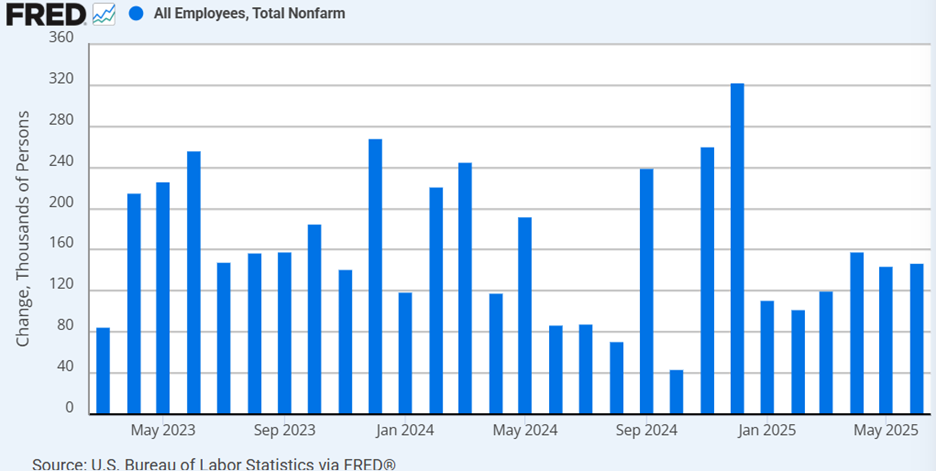
US employers added 147,000 jobs in June, up slightly from May and well within range of the last year’s average as the US economy grew nearly 3%.
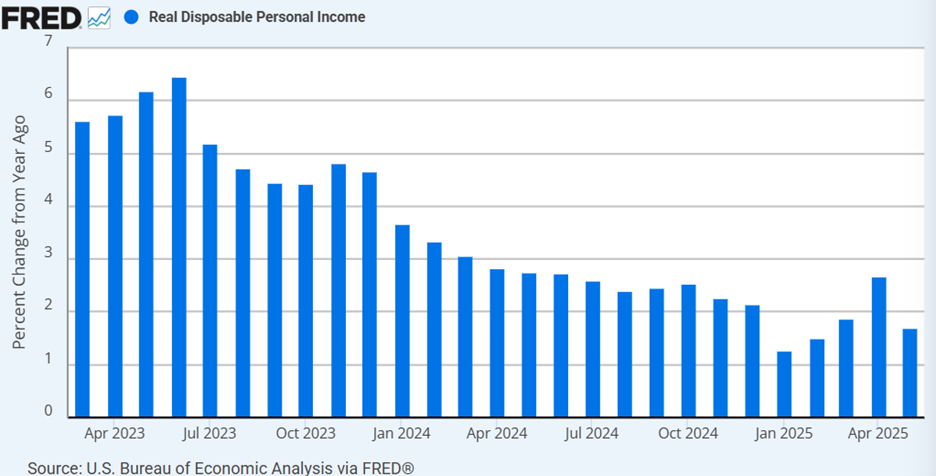
While job growth has maintained loft, real disposable personal income gains have fallen towards levels more consistent with slower economic growth as wage pressures abate. Tariff price adjustments reduce real disposable personal incomes as would any reductions in government benefits. However, real disposable personal income also includes tax payments. Any reduction in tax rates would thereby boost real disposable personal income and spending capacity for consumers. While tariffs may reduce spending power, tax cuts increase it. While economists expect tariffs to subtract less than .5% from GDP next year, they also expect the tax cuts to add over 1% to GDP.
Perhaps this explains why markets are trading at all-time highs.
Enjoy the rest of your weekend!
-David
Sources: Yardeni, Federal Reserve Bank of St. Louis, Reuters
This communication and its contents are for informational and educational purposes only and should not be used as the sole basis for any investment decision. The information contained herein is based on publicly available sources believed to be reliable but is not a representation, expressed or implied, as to the accuracy, completeness, or correctness of said information. References to political figures or policies are for informational purposes only and do not represent an endorsement by Waddell & Associates. Any forward-looking statements reflect current opinions and assumptions and are subject to change without notice; actual results may differ materially. Past performance does not guarantee future results. Waddell & Associates may use artificial intelligence tools to help generate or summarize content; all outputs are reviewed by our team for accuracy and relevance.