What a roller coaster of a first half! As I’ve told many, the first few months of 2025 have felt like a few years at this point. New administration—check. Liberation Day—check. Tax bill—check. Middle East conflict—check. New all-time highs—check. And while we spend much of our time looking forward, since we’ve reached the halfway mark of 2025, I think it’s an appropriate time to look back at the first half of the year.
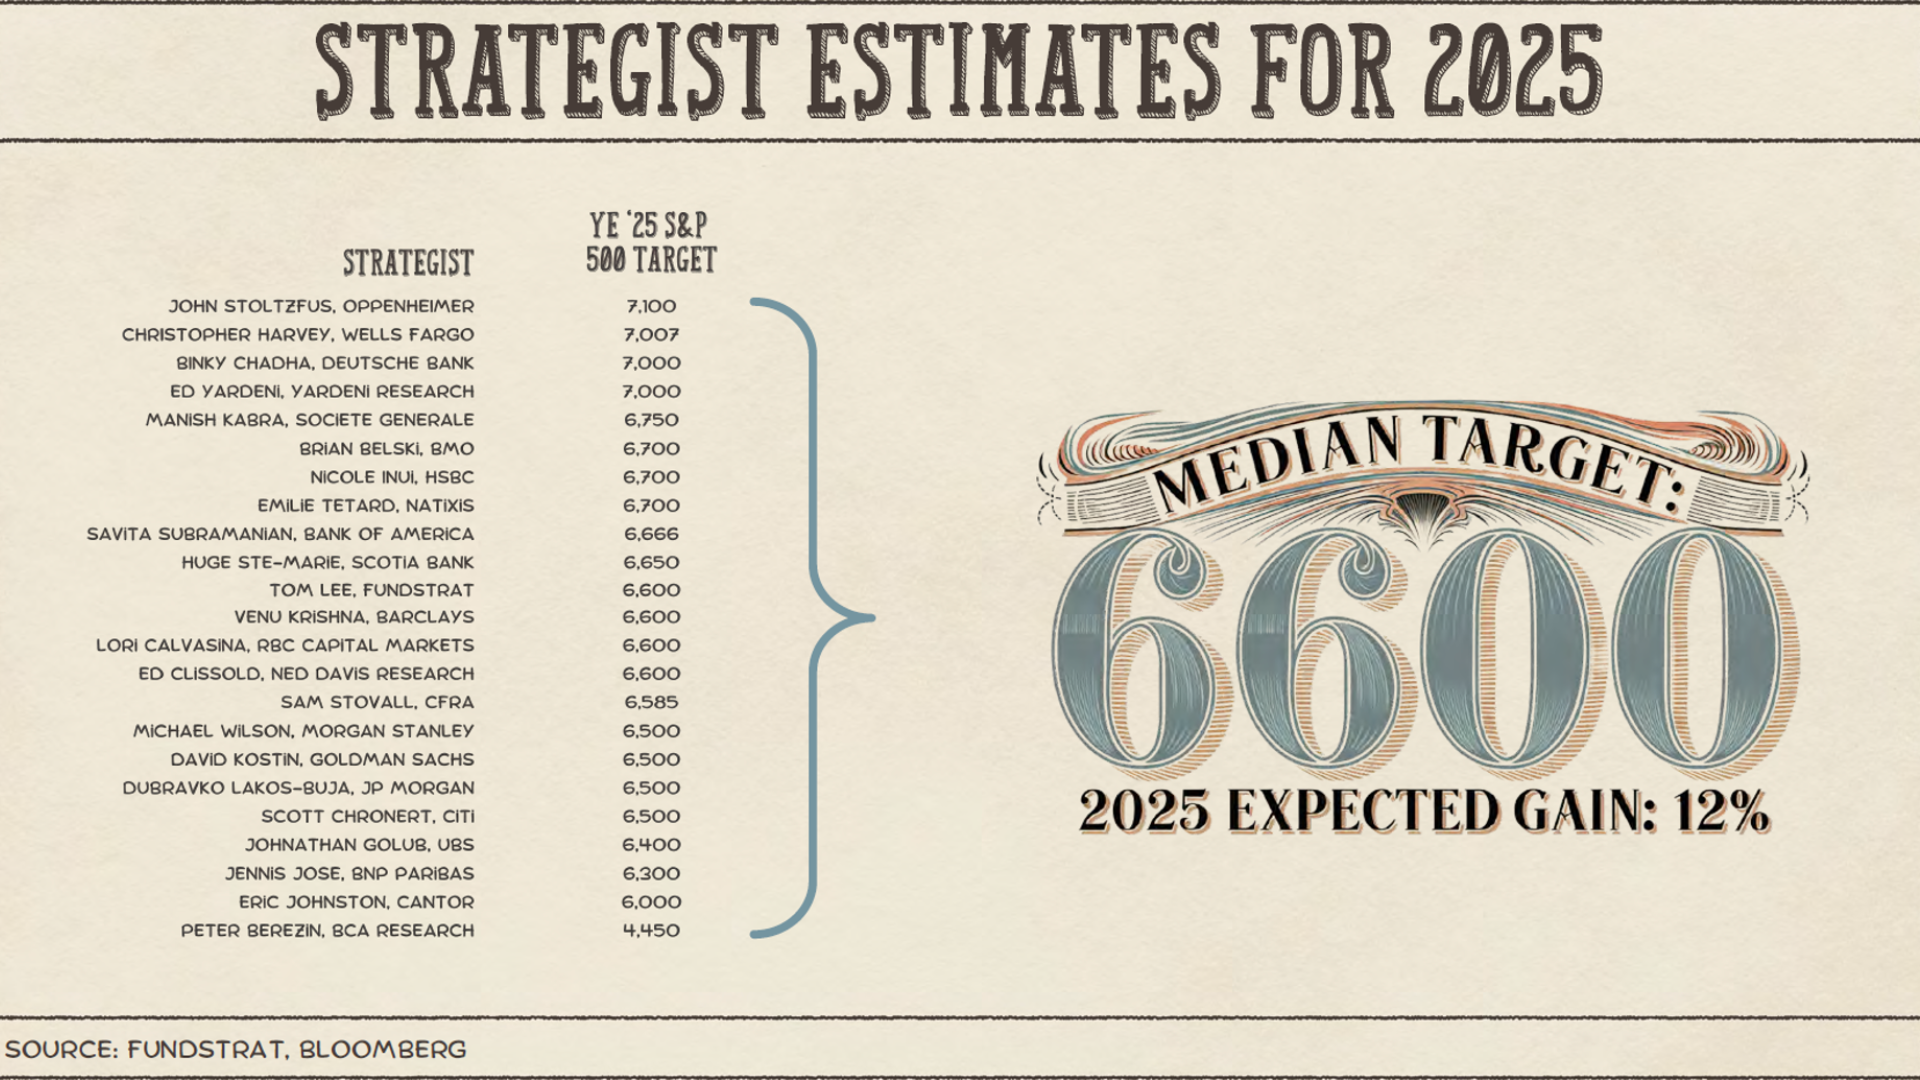
At the outset of the year, the median 2025 year-end target for the S&P 500 from strategists across Wall Street sat at 6,600, or a 12% gain. Today the index sits at nearly 6,175, up ~5% on the year. Most strategists were forecasting some market appreciation, while strategists at Oppenheimer, Wells, Deutchse, and even Yardeni predicted nearly 20% returns this year.
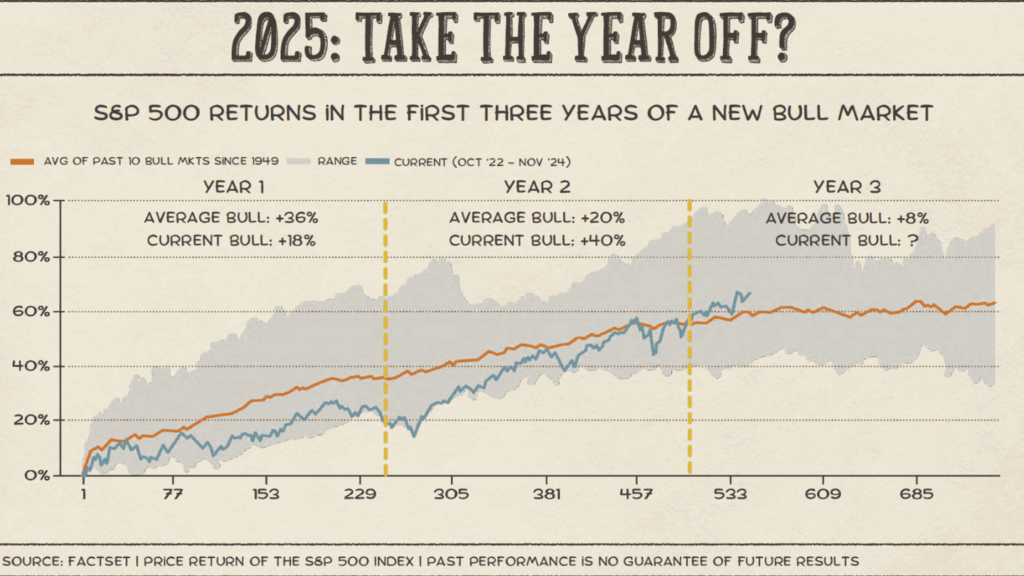
As we opined in our 2025 outlook presentation, we were cautiously optimistic that the bull market would continue, but likely in a more muted fashion. After big returns in 2023 and 2024, returns in year 3 of bull markets typically take a breather, averaging a modest 8%. Halfway through the year, we’re right on track.
If you missed the first half of the year and woke up today +5% year-to-date, congratulations on avoiding the news cycles. Funny how that works! Volatility, as measured by the VIX, ballooned north of 60 on April 7th and crashed to near 16 today (Friday, June 27th, 2025).
Similarly, high yield spreads are down 33% over the same time. Even oil prices that once rocketed on escalating tensions in the Middle East cratered -12% last week on news of a ceasefire. Many markets are back at all-time highs, having recalibrated to the news frequency and distribution methods of the new US administration.
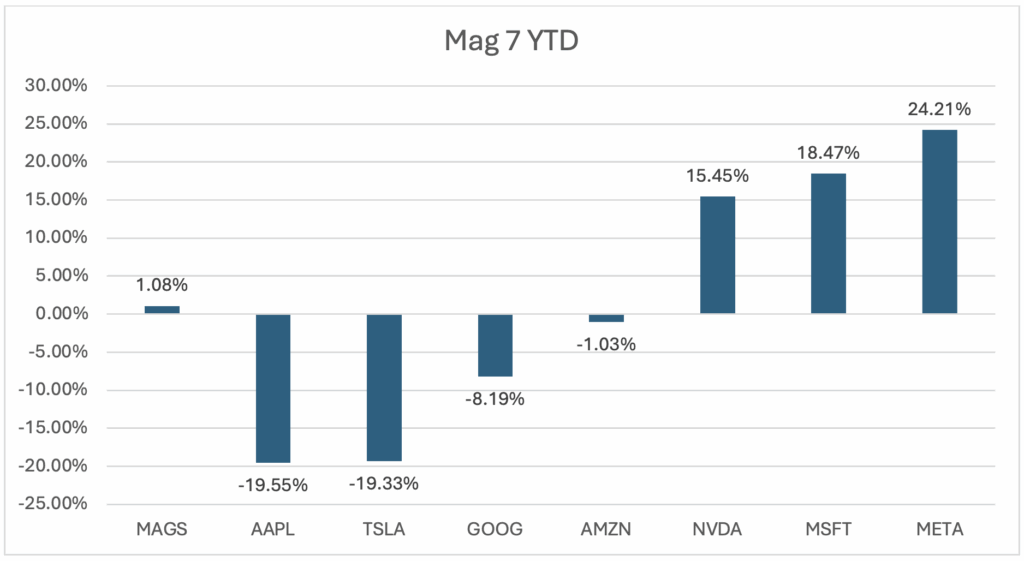
Though the S&P sits +5% this year, the source of return inside the US has varied. Take the Mag-7. Combined, they are mostly flat on the year, with Apple and Tesla lagging and Meta, Microsoft, and Nvidia leading the way:
Source: YCharts, 6/27/2025
Outside of US equities, international stocks are up 19% (ETF: IEFA), while emerging markets are up 16% (ETF: EEM). Bond investors have been paid as well, with various US bond indices up between 3-4% year-to-date (AGG, LQD, and HYG, etc.). Not to be outdone, gold and silver are both up 25% (ETF: GLD & SLV). Overall, it’s been a great start to the year across most asset classes!
What lies ahead?
Of course we can’t just look backwards, though! Looking ahead, we are moving towards what are known as the seasonally weak months of the early fall. However, we first need to navigate July.
What makes this July unique is the volatility wind-down from April. When volatility blows out like it did in April, volatility-control funds, by nature of their rules, pare down exposure to keep overall portfolio volatility at a certain level. But, as realized volatility rolls off, they go from net sellers to net buyers. And for the folks that follow this space closely, next month the volatility metrics tell us vol-control funds will be big buyers—so big that the projected monthly purchase from vol-control funds is the biggest it’s ever been as far back as the data has been tracked (2004). On to the second half!
Have a great weekend!
-Matt
Sources: YCharts, Nomura Asset Management
This communication and its contents are for informational and educational purposes only and should not be used as the sole basis for any investment decision. Waddell & Associates does not provide personalized investment advice through this communication. The information contained herein is based on publicly available sources believed to be reliable but is not a representation, expressed or implied, as to the accuracy, completeness, or correctness of said information. Past performance does not guarantee future results.