US markets have kicked off 2025 mostly without a clear sense of direction, however the calendar year isn’t necessarily what’s most important during market and economic cycles. Jerome Powell and the US Federal Reserve initiated a rate-cutting cycle back on September 18th, 2024, and it’s the specific points in cycle time that matter most to long-term investors. While we await the news of Trump and his administration’s course of action over the next several weeks, let’s pause and reflect on a few specific indicators to identify a parallel market cycle and its resulting path.
The 90’s!
Comparing different market cycles is a lot like the arguments about the greatest athletes of all time in their respective sports. In basketball, most often this becomes Michael Jordan or Lebron James, but the disagreement often ends with each side firmly entrenched in their belief with the mutual understanding that they played in different eras; in other words, agree to disagree. The same, too, can be said of comparing market cycles—but it’s fun to do it anyhow!
The Fed’s Playbook: 1995 vs. 2024
A close comparison to this market cycle is the mid-1990’s. Of course, there are inconsistencies and differences, and although history does not necessarily repeat itself, it often rhymes. I won’t tell you how old I was in 1995, but at the time, Fed chair Alan Greenspan kicked off a rate-cutting cycle in response to signs of deteriorating economic growth after having tamed a slight rise in inflation in the years prior. Cue the comparison!
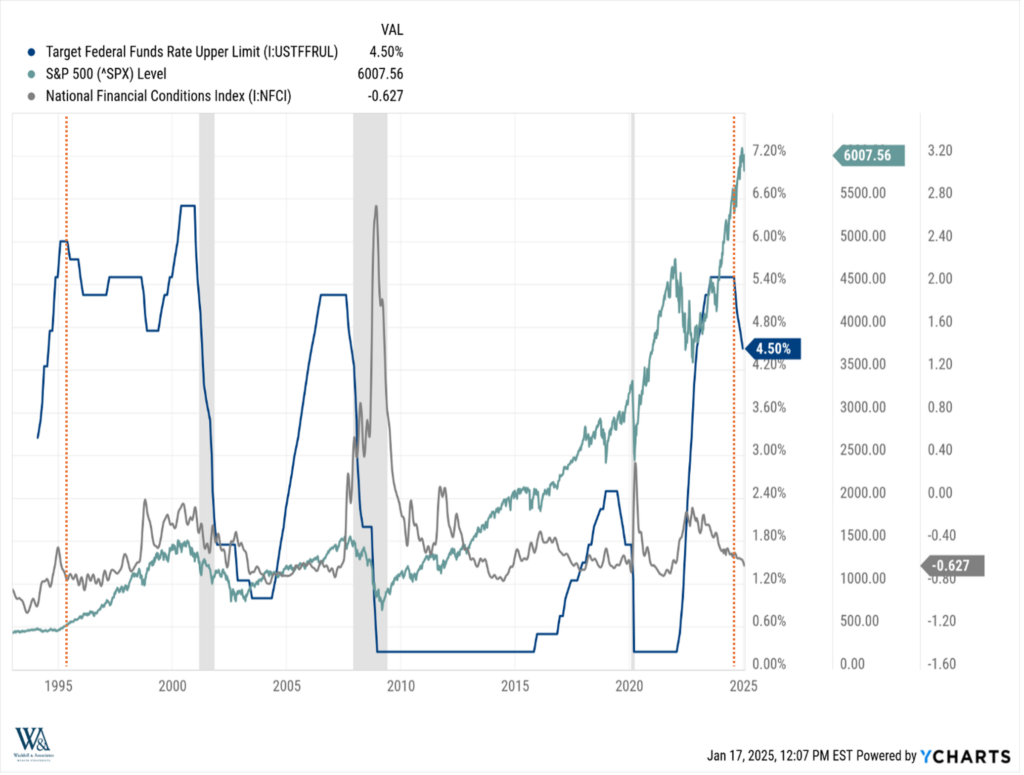
Current Fed chair Jerome Powell began a rate-cutting cycle this past September across a similar backdrop of relatively loose financial conditions, with US equity markets at very-near all-time highs:

It’s a noisy chart, but you’ll see, as marked by the vertical orange lines, that both Greenspan and Powell started cutting interest rates under a similar set: loose financial conditions as measured by the Chicago Fed National Financial Conditions index, and newly minted all-time highs in US equity markets as measured by the S&P 500 index. Of course, after Greenspan’s cuts in 1995, we see what happened thereafter: the S&P 500 continued its run under relatively loose financial conditions until 2000.
Why Financial Conditions Matter
Why do financial conditions matter? In simple terms, they are a measure of relative liquidity available in the marketplace. Typically, excess liquidity ends up flowing into investment assets, thereby boosting asset prices. On the other hand, as financial conditions tighten, asset prices typically come under pressure as liquidity exits the system. You can see this on the same chart as conditions tightened into 2000, 2007, and 2022.
A Stronger Dollar: Echoes of 1995
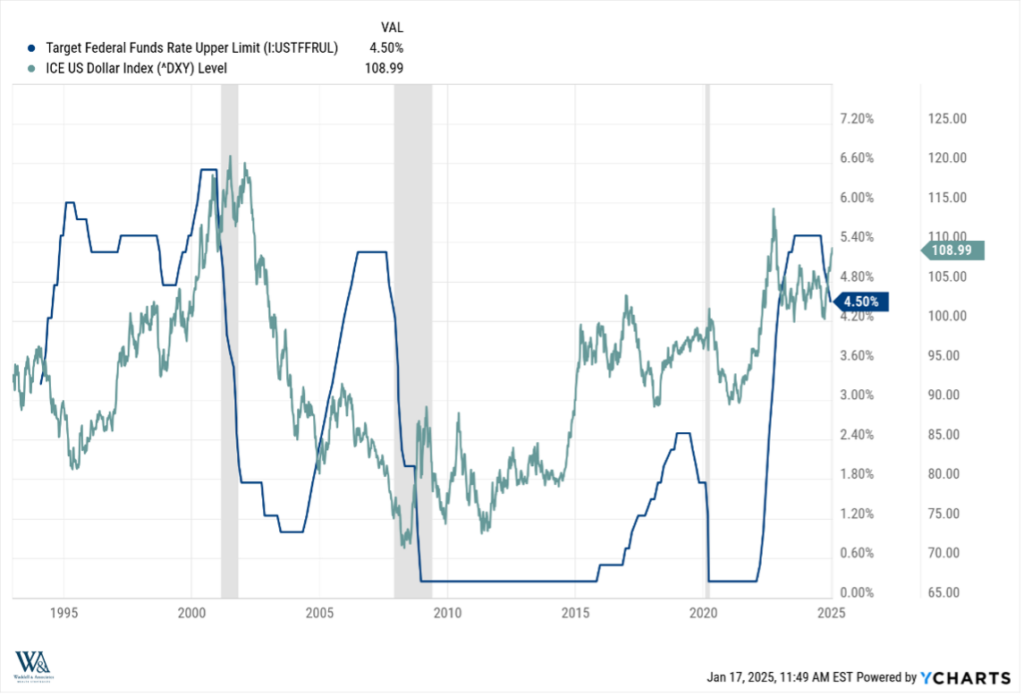
Like financial conditions and equity prices, the direction of the USD has taken a similar path to Greenspan’s1995 rate-cut cycle:

The dollar index, as measured by DXY, ramped almost 50% from 1995 to 2000, following Greenspan’s first cut in 1995. The DXY index is a relative value, meaning US dollar strength is also a function of the strength or weakness against other currencies. Fast forward to today, and since Powell’s first cut in September, the dollar has appreciated almost 10% in a few short months. We will be keen to watch if this trend continues or reverses course.
What’s Different This Time?
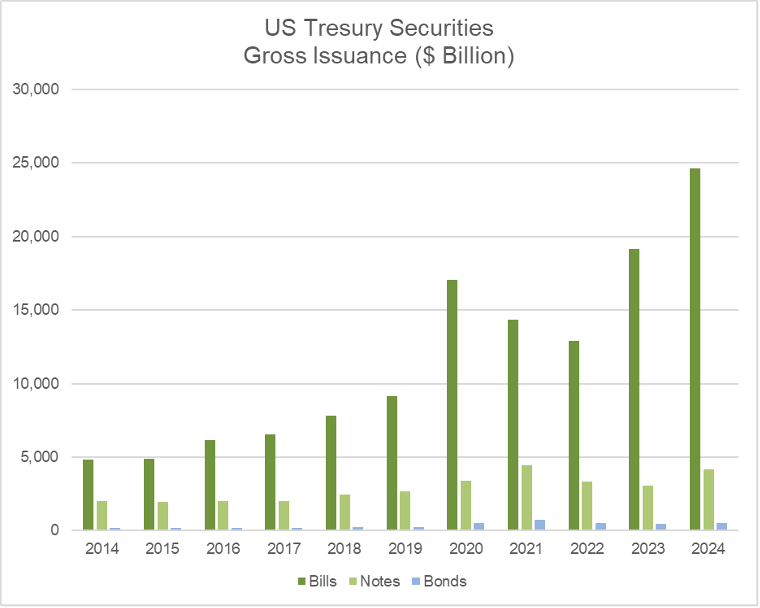
As is the case in comparing anything, it’s important to highlight the differences as well. The US federal debt to GDP is almost twice as high now as it was in 1995, and the Fed’s behavior changed dramatically after the Great Financial Crisis in 2008. Across the current cycle, as the Fed began raising interest rates in 2022, the US Treasury countered this Fed financial tightening by issuing short US Treasury Bills, as opposed to longer-dated maturity notes and bonds, to finance the US Government. Ultimately, as we can see in the Financial Conditions Index, it’s ended up loosening financial conditions, providing a tailwind and support for US equities.

Following the Cycle’s Path Forward
As we move forward from this particular point in cycle time, we will closely monitor financial conditions, as they can be a helpful indicator in the future direction of US equity markets.
Have a great week!
-Matt
Sources: YCharts, SIMFA Research
This communication and its contents are for informational and educational purposes only and should not be used as the sole basis for any investment decision. The information contained herein is based on publicly available sources believed to be reliable but is not a representation, expressed or implied, as to the accuracy, completeness, or correctness of said information. Past performance does not guarantee future results.

