Since we flipped the calendar to October, American baseball is at the peak of its glory. It doesn’t get much better than playoff baseball, especially after waiting since April for it to get here. Recently, all-time hits leader and controversial figure Pete Rose sadly passed away. Having spent a few of my formative years in Cincinnati, I thought it appropriate to pay respects to a generational talent. Understanding that Pete was ultimately a numbers guy, let’s take the score of the game as we slide headfirst into year-end.
“Am I still in uniform? Then I ain’t retired.” – Pete Rose
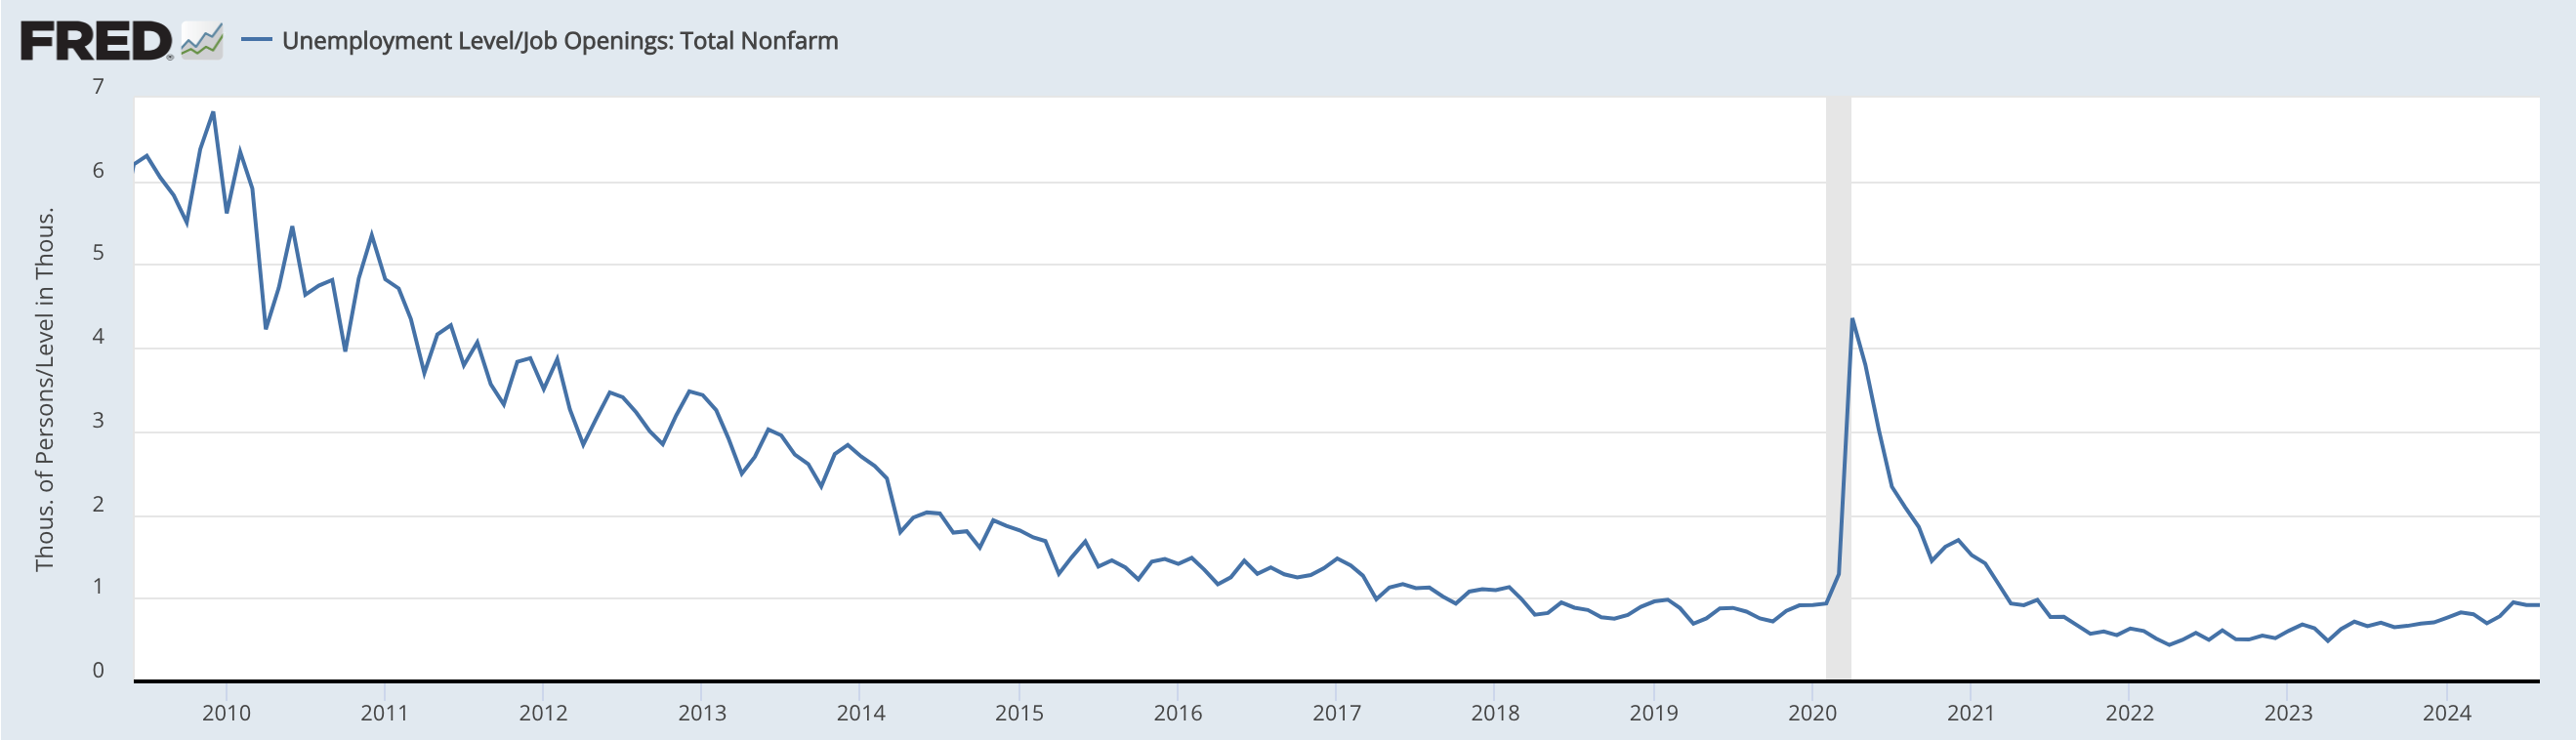
In last week’s blog, we highlighted the latest US payroll data, which showed nonfarm payrolls adding 254,000 jobs in September—almost 70% more than expected. This week, we received the latest jobless claims data, which increased by 33,000 over the previous period. However, seasonal trends and two life-altering hurricanes are the culprit in what amounts to noisy data. Overall, US job creation and employment gains have been healthy, and notably, the number of unemployed per job opening is normalizing and only returning to pre-covid levels:
“I’d walk through hell in a gasoline suit to play baseball.” – Pete Rose
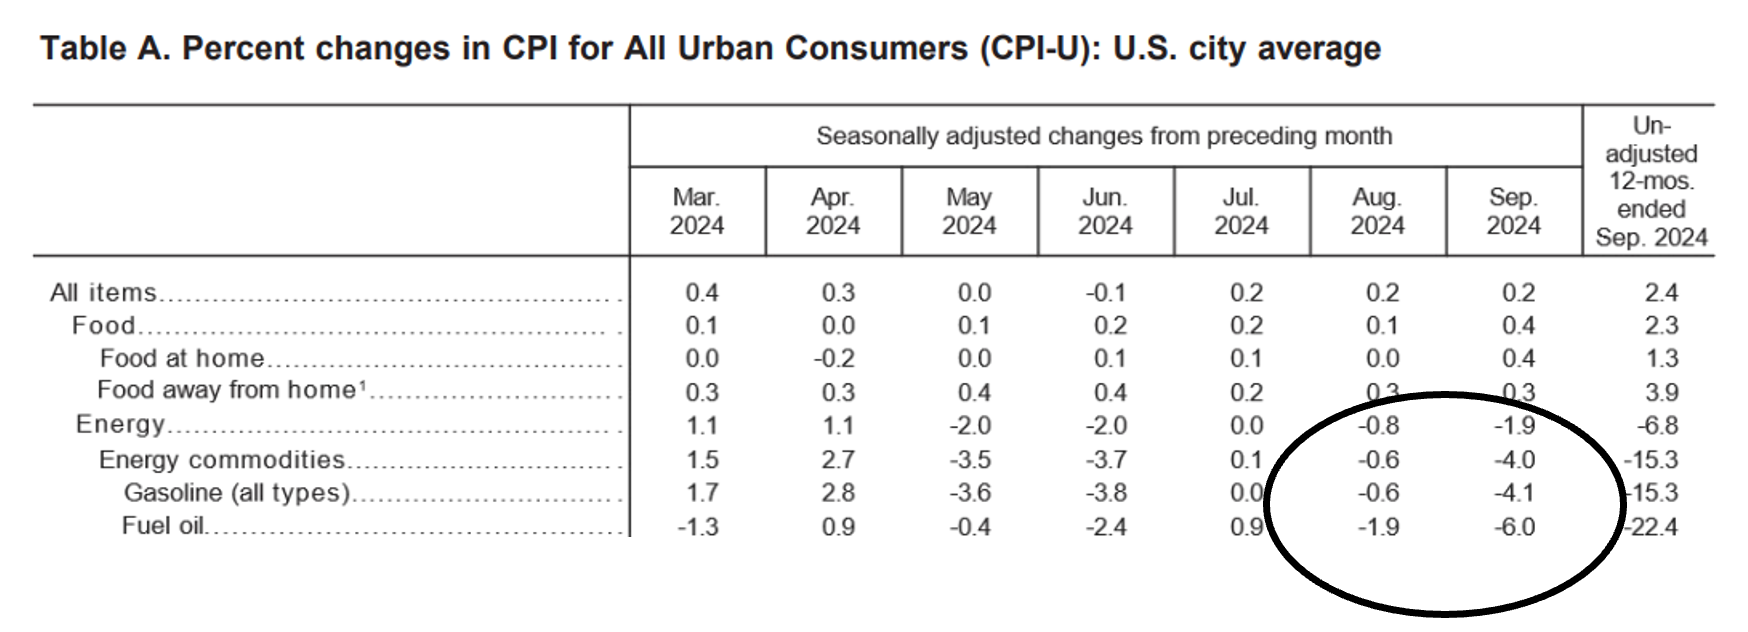
The other “job” of the Fed is to achieve stable prices, so let’s read through the latest CPI data from this week. The good news: year over year headline inflation is now down to 2.4% as of Thursday’s data, closing in on the Fed’s 2% target. However, inflation ex-food and energy showed an acceleration year-over-year of 3.3%. If you look at the numbers behind the headline percentage change, you will see that although inflation is lower year-over-year, it comes with the tremendous help of falling gasoline and oil prices in August and September:
Why is this important? Well, since Brent Crude Oil prices approached their cycle lows on September 10th, prices are back up almost 16%! This comes alongside a breakout in other commodity prices (though not directly captured in the CPI calculations) which will be felt throughout markets and investor pockets. In sum, what has been a helpful offset to headline inflation numbers might now be additive going forward.
7th Inning Stretch
A lot of times, we can lose ourselves in the middle of an inning and lose sight of the score of the game. In investing terms—dive too deep into the day-to-day and lose sight of the longer-term secular trends. With all the noise last week about the upside surprise employment data and similar surprise this week in inflation data, US equity and bond markets day-to-day have been more volatile than usual.
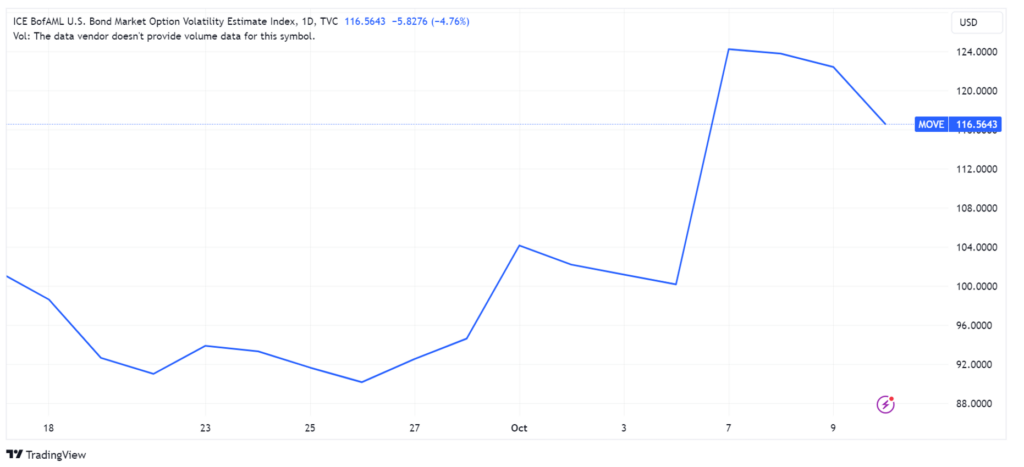
For example, the MOVE index is a measure of US bond market volatility. Since the fed rate cut on September 18th, the MOVE index has ramped almost 30% (!), one of the largest moves since 2020. Similarly, US equity market volatility measured by the VIX remains at near 21, which is elevated enough for markets to remain choppy.
Let’s drown out all the noise and take the score of the game with year-to-date returns of major asset classes:
| Index | YTD |
| S&P 500 Total Return | 23% |
| MSCI ACWI | 19% |
| MSCI Emerging Markets Total Return | 16% |
| MSCI EAFE Total Return | 11% |
| Bloomberg US Aggregate | 3% |
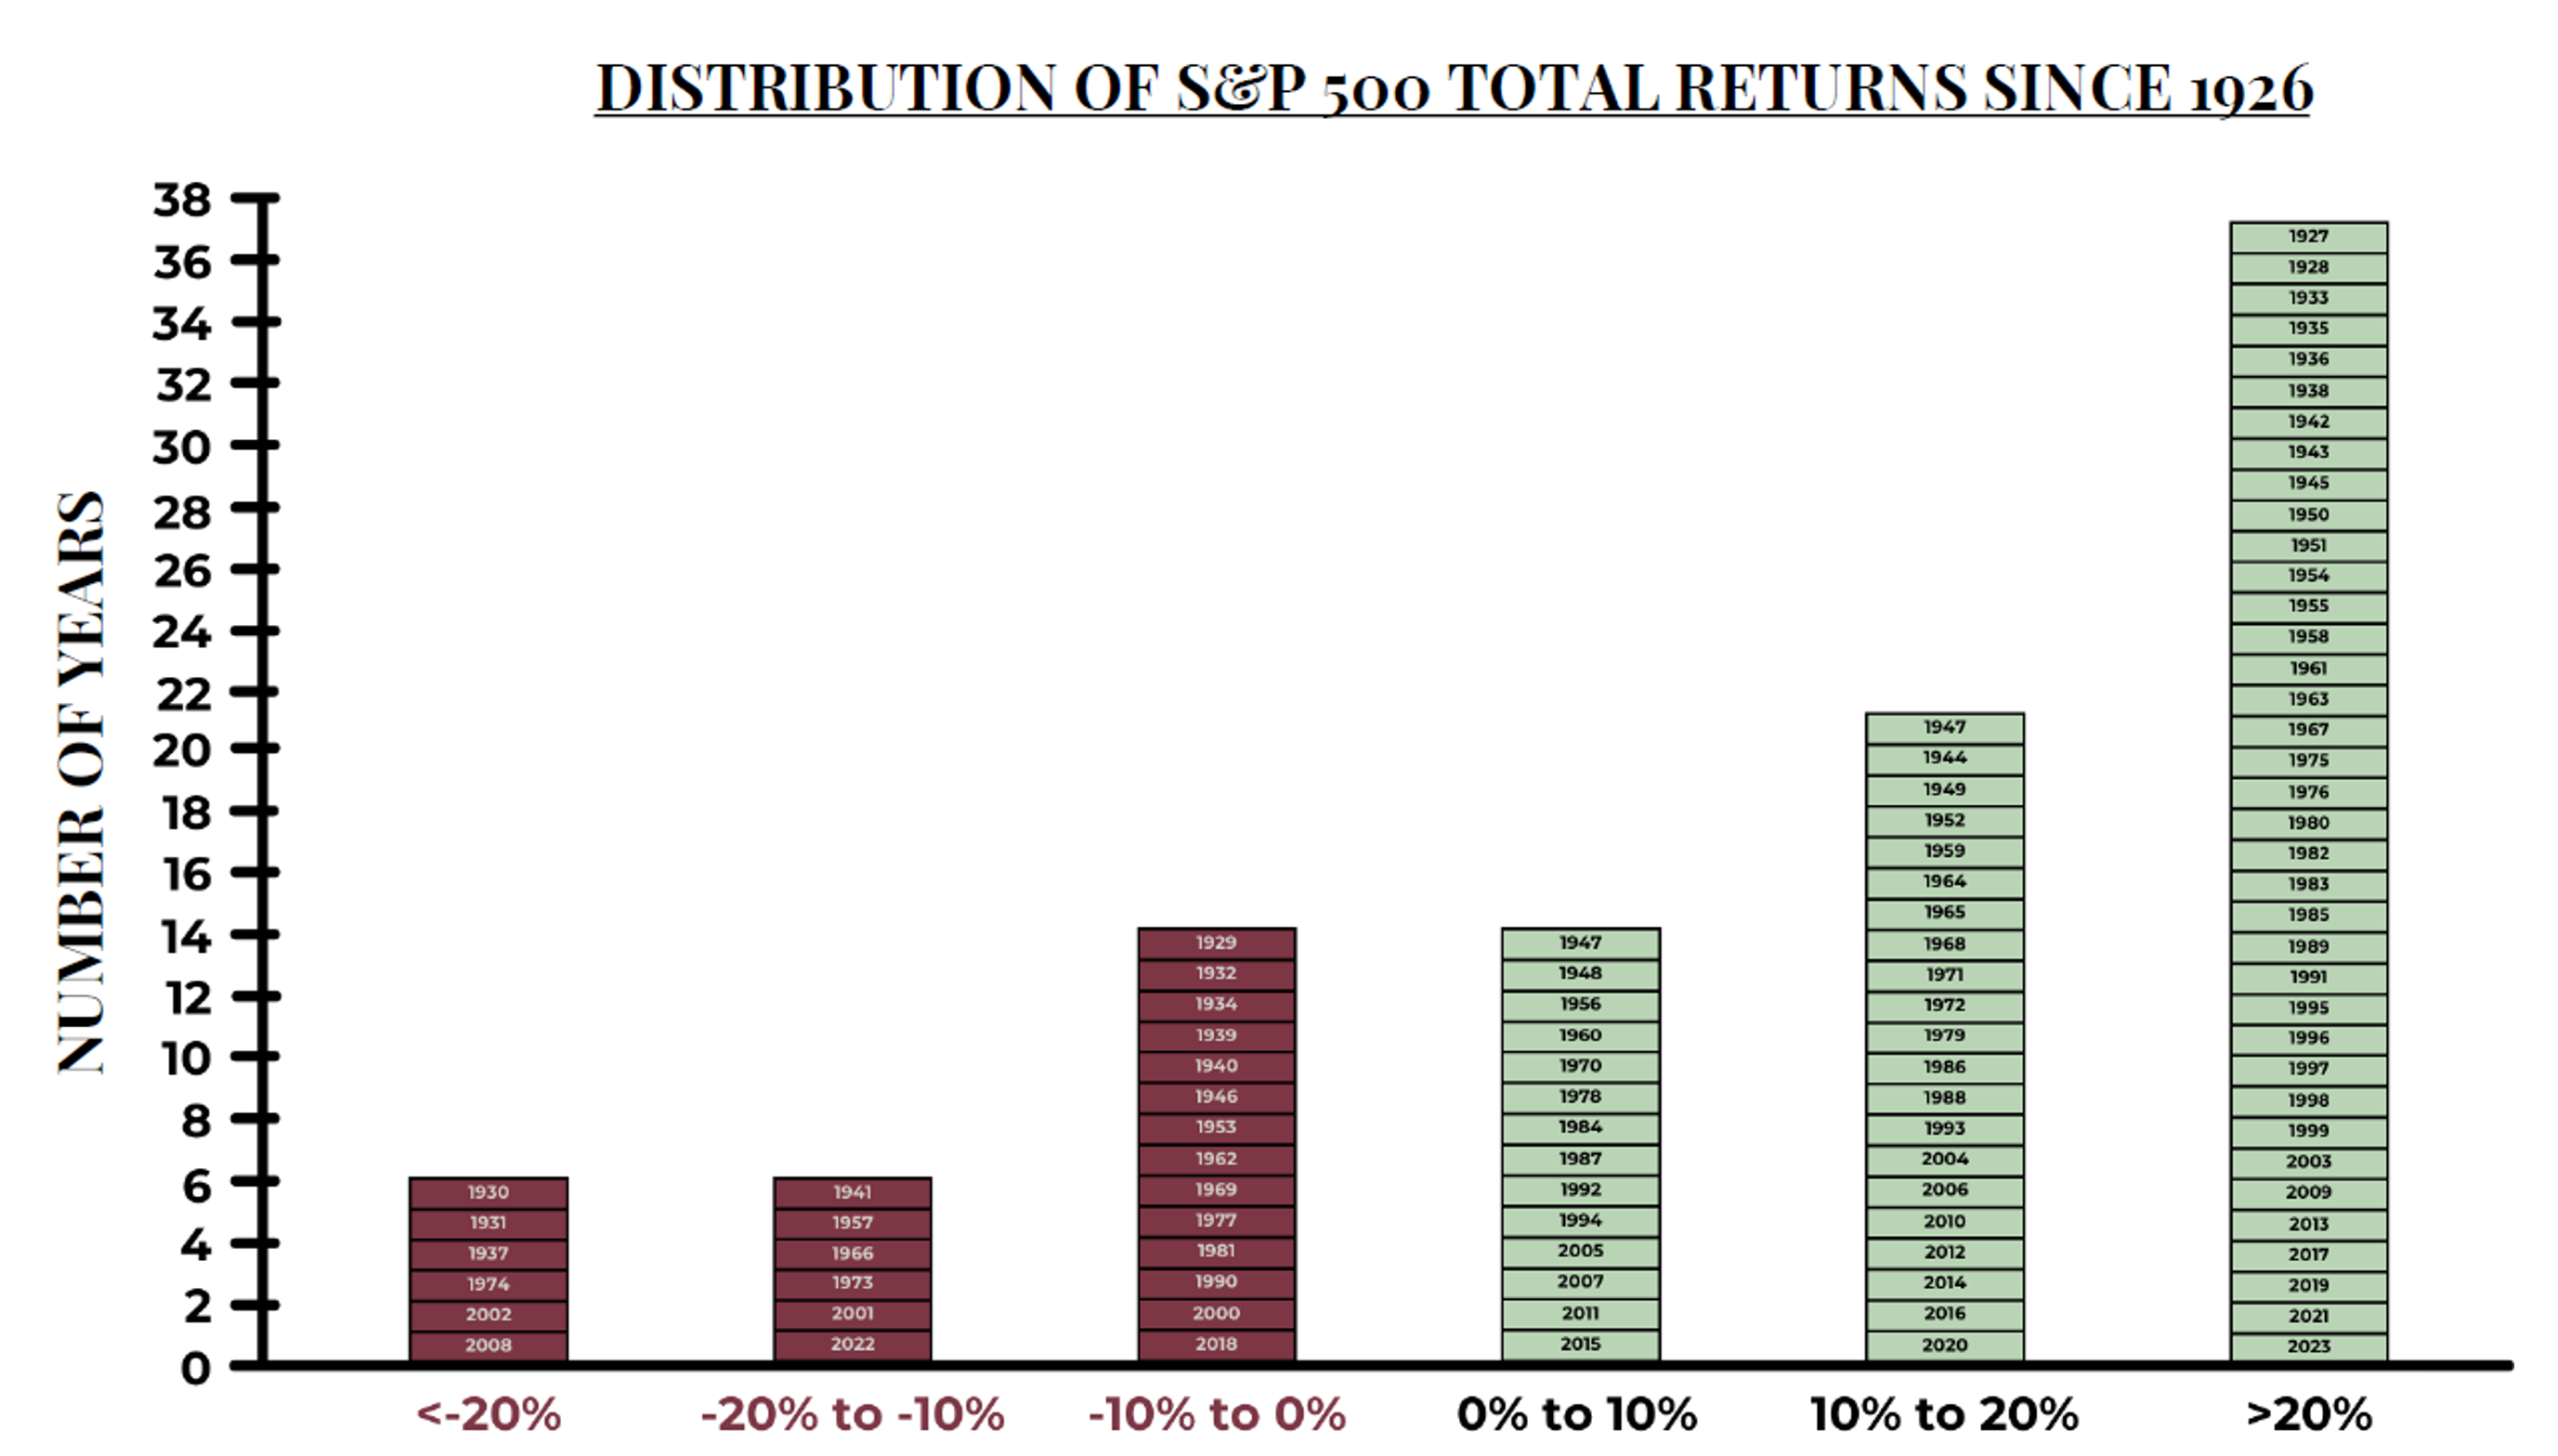
US equity markets led by the S&P 500 are well ahead as we enter into the final earnings season of the calendar year. It’s a good reminder that annual US equity market returns are more often greater than 20% than they are negative!
Have a great rest of your weekend,
Matt Gentzkow, Investment Strategist
Sources: FRED, Bureau of Labor Statistics, Trading View, YCharts, FactSet, S&P
This communication and its contents are for informational and educational purposes only and should not be used as the sole basis for any investment decision. The information contained herein is based on publicly available sources believed to be reliable but is not a representation, expressed or implied, as to the accuracy, completeness, or correctness of said information. Past performance does not guarantee future results.