As we have discussed recently, the Fed’s directive and therefore the market’s attention, has pivoted from fighting inflation to fighting recession. This creates data response inversions for investors. For example, previously stronger-than-expected labor market reports flamed inflationary fears, resulting in market declines. Today, stronger-than-expected labor market reports dispel recession fears, resulting in market advances. Same report, inverted response. The game has changed. Welcome to the prize fight between the Recessionists and the Expansionists. Let’s survey the September data reported this week and see who’s ahead.
GDP Tenacity
On September 26th, the government revised its estimate of U.S. GDP growth upward by 1.3%, revealing a more robust economy than previously reported:
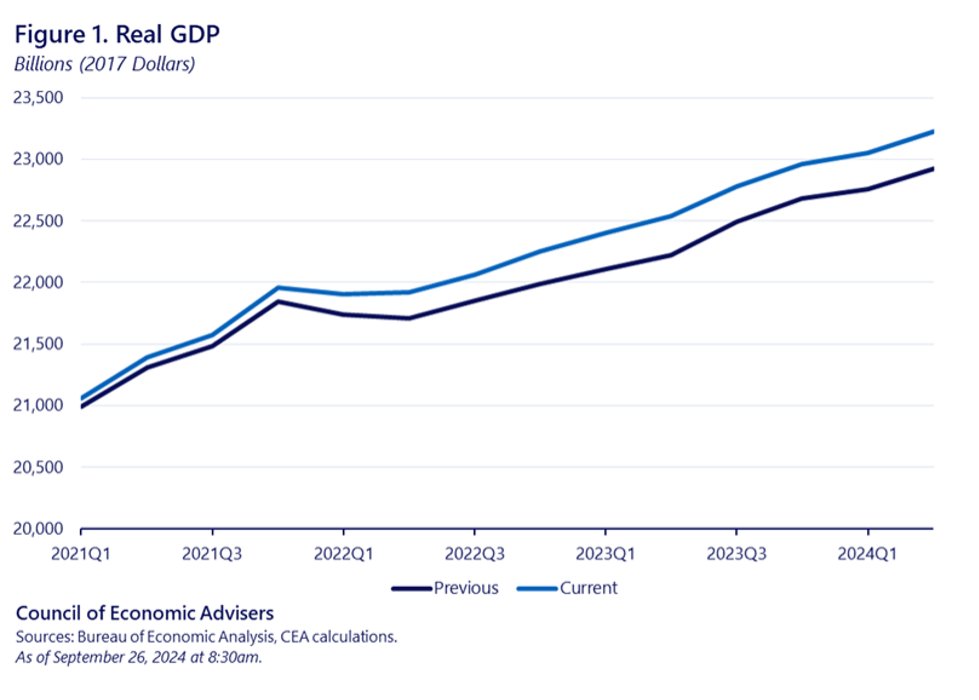
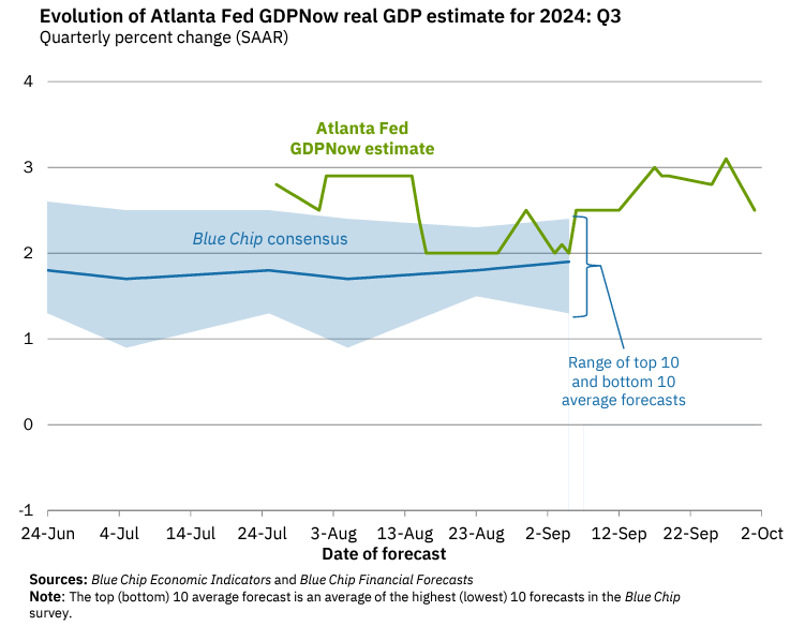
Additionally, the Government reaffirmed its 3% read on second quarter GDP growth. Taken together, these revisions depict an economy with even more momentum and resilience than previously assumed. This momentum also carried over into the third quarter as the Fed’s GDPNow tracker projects a 2.5% growth rate for the quarter, well above the 1.8% “neutral” growth rate projected for the economy:
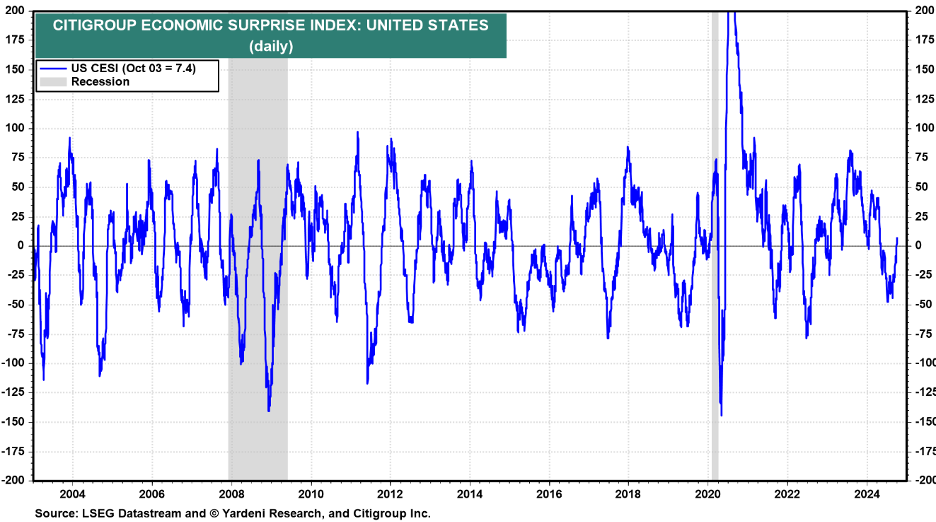
Reinforcing the rosy economic projections for the 3rd quarter, recent economic data releases have been surprising to the upside as seen in the Citigroup Economic Surprise Index:
Labor Market Merriment
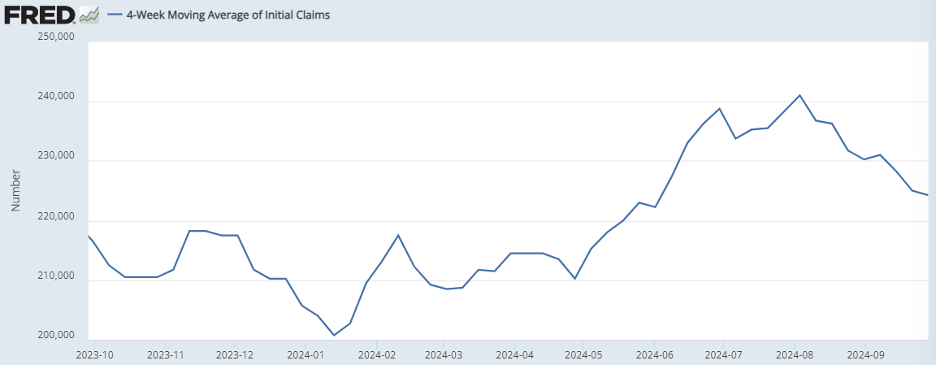
The Fed views recessions through the lens of labor market weakness. Therefore, the pivot towards recession watch equates to a pivot towards labor market watch, making the weekly unemployment claims and monthly labor reports the most important data releases for the markets now. While we did see an uptick in unemployment claims between May and August, the trend has since reversed, underscoring labor market resilience:
Furthermore, as per Friday’s jobs data, the U.S. not only added many more jobs than expected in September, but the BLS also revised August higher by 17,000 and July higher by 55,000:
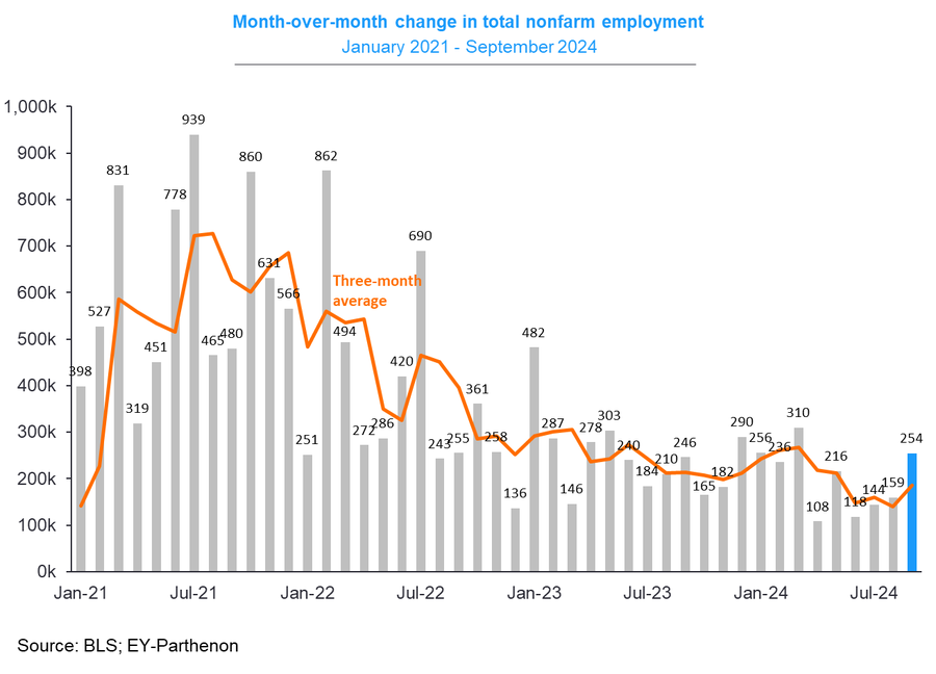
Fortunately, while the stronger-than-expected release and revisions depict a robust labor market, wage growth continues to slowly “normalize”:
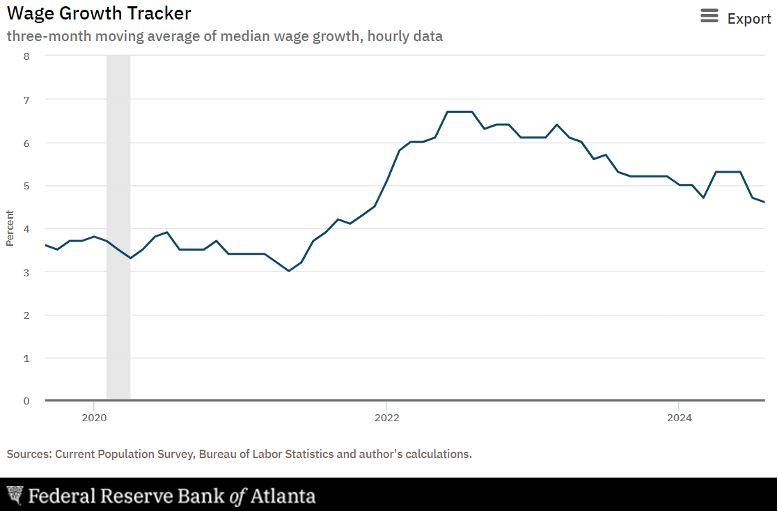
In sum, a labor market performing above trend compensates consumers above trend, leading to consumption above trend, supporting GDP growth above trend. No signs of recession here.
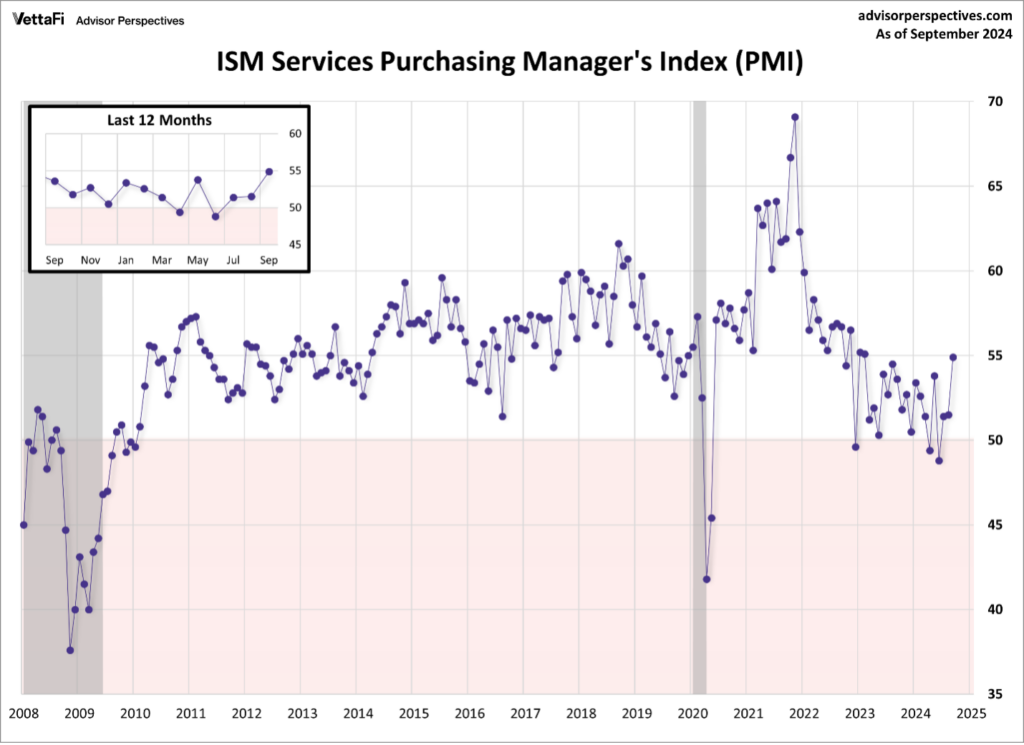
For extra credit, two additional indicators we track closely for recession suggestion align with continued GDP expansion. The ISM Services index which tracks services related businesses (70% of the U.S. GDP) registered 55 in September, well over the 50-level signifying growth. This was the highest reading since February 2023.
Lastly, The Fed’s recent interest rate reduction didn’t lower longer-term mortgage rates, but did lower shorter-term rates builders rely more heavily on for housing construction. August posted a substantial rebound in housing starts that likely carried into September given the interest rate tailwinds and improvement in homebuilder sentiment for the first time since May:
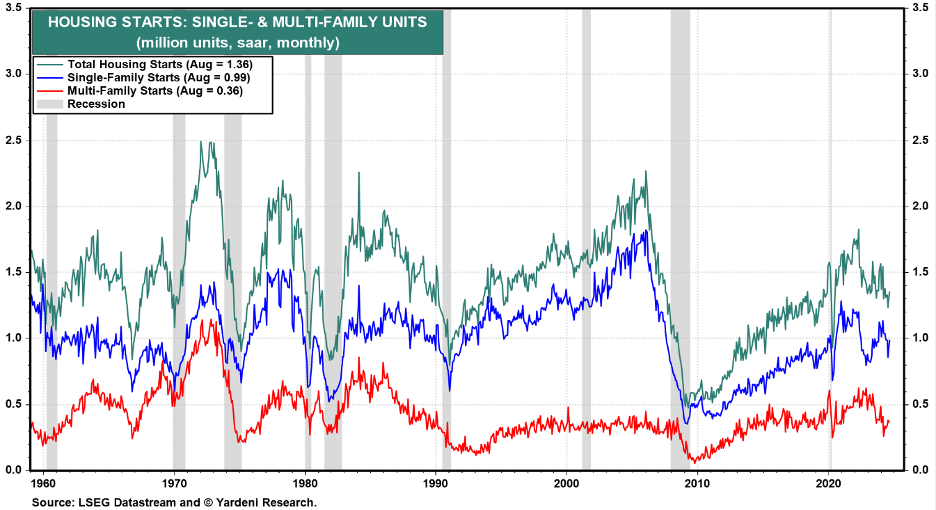
We suspect that residential investment will contribute to GDP growth in Q3 when numbers are released on October 30th, a highly reassuring signal that the U.S. economy isn’t on the cusp of recession.
Small Cap Confirmation
Markets do an excellent job of synthesizing data. Because smaller companies bear the brunt of recessionary conditions, the direction of the Russell 2000 small cap index provides the best arbiter of investor recession anxieties. Over the past three months, the Russell 2000 has gained 9.48%, vs. the more stalwart S&P 500, which returned 3.24%. Advantage small caps. And therefore, overall thus far in our prize fight… advantage Expansionists!
Enjoy your weekend!
-David
Sources: U.S. Bureau of Economic Analysis, Blue Chip Economic Indicators, LSEG Datastream, Yardeni, Citigroup, FRED, Bureau of Labor Statistics, EY-Parthenon, Current Population Survey, Federal Reserve Bank of America Calculations
This communication and its contents are for informational and educational purposes only and should not be used as the sole basis for any investment decision. The information contained herein is based on publicly available sources believed to be reliable but is not a representation, expressed or implied, as to the accuracy, completeness, or correctness of said information. Past performance does not guarantee future results.

