Markets slid sideways this week lacking meaningful catalysts. Earnings season has ended. Inflation data arrived as expected. Sentiment levels sit at neutral levels. Interest rates considered moving higher but lacked conviction and returned to base. It may be a tad early to say… but cue the summer doldrums! To entertain you nonetheless, I thought it might be fun to take a trip around the globe to see how global markets are comparing:
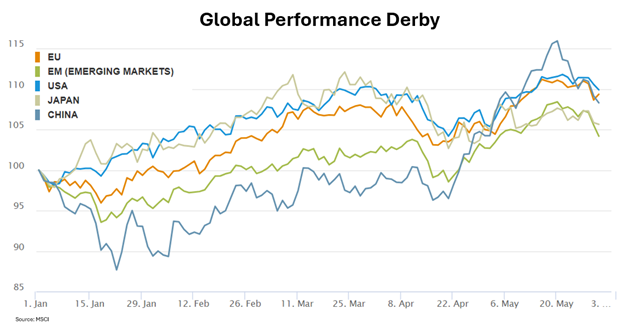
Using MSCI data, I have indexed each of our contestant markets back to 100 to start the year. As you may recall, the Japanese market jumped out to an early lead with the Nikkei index reaching a new all-time high after a 34-year hiatus. The US followed closely behind as Nvidia and its AI friends powered indices higher. The European Union constituents nearly maintained pace as unlikely members like Italy and Spain contributed solid results. The emerging markets stumbled with China to begin the year, but stimulus efforts and housing support fueled an April advance that lifted China briefly into first place. All told, with 5 months in the books, the USA takes first place with a 9.9% gain, the EU takes second with a 9.4% gain, China takes third with an 8.3% gain, Japan takes fourth with a 5.6% gain, and the emerging markets takes fifth with a 4.2% gain. However…

When evaluating performance removing US dollar movements, the leaderboard changes. Using local currencies, Japan places first with a 17.3% gain, the EU places second with an 11.7% gain, the US places third with a 9.9% gain, China fourth with an 8.7% gain, and the emerging markets fifth with a 7.1% gain. Clearly, movements in the US dollar explain a great deal of non-US returns for US investors. Many investors view international markets as “inferior” return generators, but that’s not necessarily true. Much of the return differential stems from the relative strength in the US dollar:

Over the past 10 years, the US dollar has appreciated 30% against its international peer group. That adds a 30% tailwind for US dollar investors at home and a 30% headwind for US investors abroad. Consider the influence of dollar direction on the following asset classes:

In periods going back to 1974 when the US dollar rose, US equities gained 1.8%, while developed market international equities lost 1.5%, and emerging market equities lost 2.6%. In periods when the US dollar fell, US equities gained 4.5%, while developed market international equities gained 6.9% and emerging market equities gained 7.9%. Clearly, all markets prefer a weaker US currency for reasons I’ll reserve for another email, but international equities enjoy outsized returns.
Year-to-date the US dollar has gained 3.3%. It peaked with a near 5% gain mid-April. With the Fed closing in on cutting rates, record amounts of US treasury issuance, Chinese stimulus impacts, periodic currency interventions, and surprisingly good economic data coming out of Europe, the dollar could continue its glidepath lower through the second half of 2024. If so, the second derby chart may make a better bet than the first.
Have a great weekend!
-David
Sources: MSCI, YCharts, Factset, S&P, Bloomberg, Franklin Templeton
This communication and its contents are for informational and educational purposes only and should not be used as the sole basis for any investment decision. The information contained herein is based on publicly available sources believed to be reliable but is not a representation, expressed or implied, as to the accuracy, completeness, or correctness of said information. Past performance does not guarantee future results.