In keeping with our current framework that interest rate wiggles are noise for traders, while economic and earnings growth are news for investors, this week provided cacophonies for both. Earnings lifted markets to begin the week after two weeks of souring sentiment, only to have Thursday’s hotter-than-expected inflation report within a cooler-than-expected GDP report trigger reflexive selling. The week settled out with gains, as we expected it would, but the combination of crosscurrents left many disoriented. Stagflation narratives resurfaced. The 10-year hit its highest yield of the year. Volatility levels collapsed. Meta beat earnings and its stock plunged while Telsa missed earnings and its stock soared. In moments like these when data and commentary swirl, it is useful to read recent return data and let the patterns post the headlines themselves:
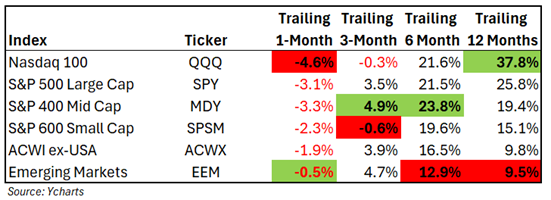
I recognize this is a lot of data so we will take it slow. I have listed the major market indices here with their trailing return data over the last month, three-month, six-month, and twelve-month periods. I have also highlighted the period winners in green and the losers in red. Over the past 12 months, the Nasdaq 100 has stolen the show thanks to its 40% weighting to the Magnificent 7. The S&P 500 follows suit given its 30% weighting to the Magnificent 7. Those indices that lack mega tech exposure returned around half as much. For the international indices, a stronger dollar over the last year deducted about 5%, making the currency-hedged versions closer to the 15% mark. When we adjust our time period to the trailing six-month interval, shifts appear. The Nasdaq 100 and the S&P 500 tie, indicating some Magnificent 7 leadership loss. In fact, both indices trail the S&P 400 mid-cap index, which has zero exposure to the Magnificent 7. Meanwhile, small caps and internationals reduce their performance gaps significantly indicating a market that has broadened participation. Over the past three months, this trend gathered more conviction as mid-caps won once again and internationals overcame currency headwinds to outperform the S&P 500 as well. Small caps experienced losses (easily explained by rising interest rates), while the NASDAQ 100 lagged badly for the first time in ages. Over the past month, the NASDAQ woes continued while small caps and internationals outperformed. In short, the influence of the Magnificent 7 has shifted from index uplift to index downforce. Let’s look within this vaunted cohort itself for details:
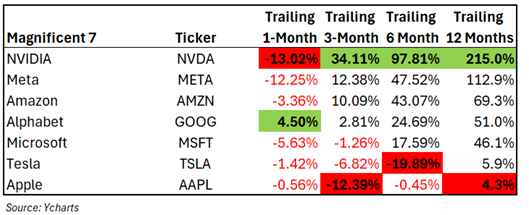
NVIDIA makes the chips that power AI. The leap in AI investment explains the leap in NVIDIA’s stock price. Its 215% gain over the past twelve months, 98% gain over the past six months, and 34% over the past three months has heroically lifted this cohort to superstar status. But what happens when we remove NVIDIA from the team?
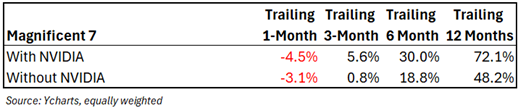
With NVIDIA, the Magnificent 7’s returns dominate every period other than the last month. Without NVIDIA, the Magnificent 7’s returns lag US mid cap and small cap returns over the past six months and even international returns over the last 3 months. Should NVIDIA produce pedestrian returns going forward the Magnificent 7 could simply become the Mediocre 7 leading investors to look elsewhere for return generation.
We entered the year expecting to see a broadening of leadership and participation away from big tech. It is now happening, and it is healthy. Using the analysis above to still the recent data and commentary swirl, the headlines generated bottom-up should read:
“The labor market, the consumer, and the economy remain resilient!”
“Corporate earnings growth will gather momentum and breadth from here!”
“Broadening market participation reflects broadening earnings growth!”
“Disinflation is decelerating… and that’s OK for stocks!”
“The current dip in markets isn’t a drawdown, it’s a redistricting!”
Have a great week!
-David
Sources: Ycharts
This communication and its contents are for informational and educational purposes only and should not be used as the sole basis for any investment decision. The information contained herein is based on publicly available sources believed to be reliable but is not a representation, expressed or implied, as to the accuracy, completeness, or correctness of said information. Past performance does not guarantee future results.