Seasonal Softness
The stock market has its own biorhythmic pattern we can often rely on for forecasting. For instance, 2023 had some promising historical return comparatives, like the third year of the presidential cycle, the year of the Rabbit in the Chinese zodiac, and the propensity of positive years following negative years. Within the year, the market has its own calendar biases leading to maxims like “sell in May and go away”. In fact, my father used to remind me annually that markets tended to sell off around my mother’s birthday on 8/23 (Happy Birthday, Mom) and recover around Halloween. While that doesn’t get media attention beyond Waddell & Associates, it’s perhaps the most reliable biorhythm of all:
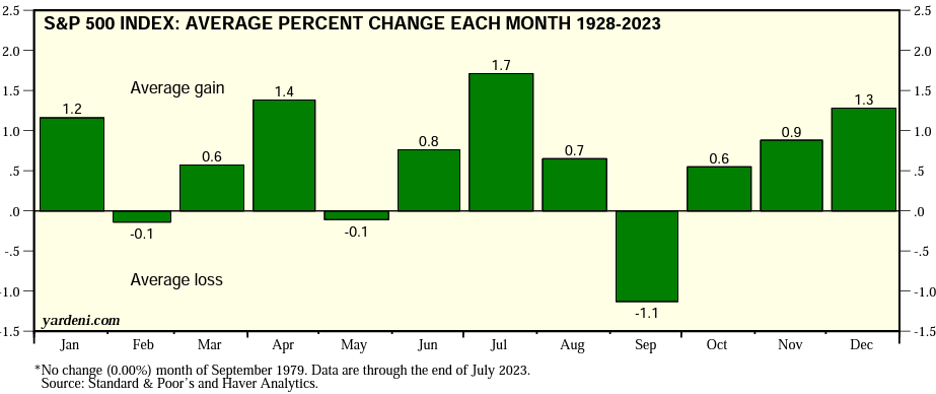
After a relentless rally to begin the year, markets were certainly due for a seasonal sell-off. History may not repeat for markets, but it does tend to bio-rhyme.
Sentiment Softness
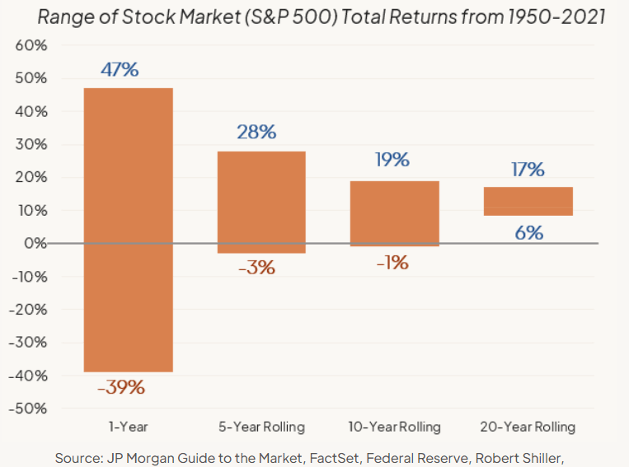
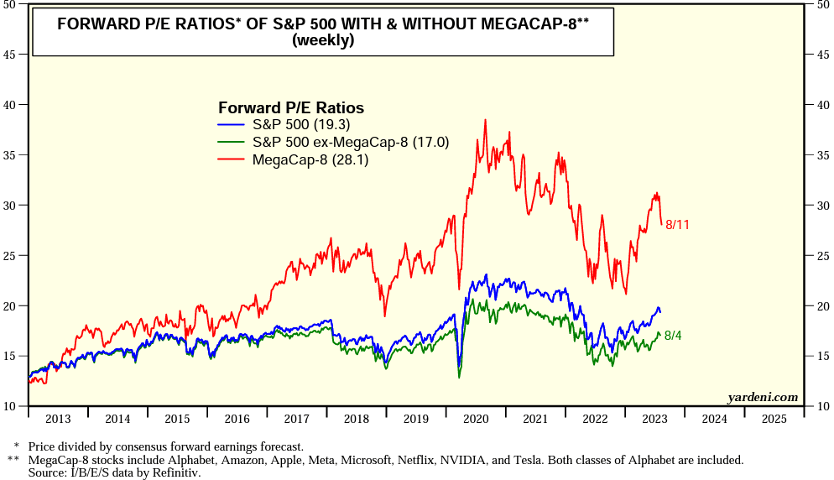
As Buffet famously quipped, “In the short run, the market is a voting machine, but in the long term, it acts like a weighing machine.” Frankly, it’s relatively easy to predict where the market will be 20 years from now and nearly impossible to predict where it will be 20 minutes from now, as the chart below demonstrates:
Therefore, within shorter timeframes, psychology and sentiment drive direction. We become very bullish whenever the number of retail investor bulls (those who think the market will rise over the next six months) drops below 20%… as they did towards the end of 2022. This helped fortify our optimism for 2023. Unfortunately, the opposite holds true as well. When investors become overly bullish, the market tends to struggle until sentiment corrects. As we noted in our halftime report, investor sentiment recovered strongly in the first half as inflation surprised to the downside and economic growth surprised to the upside. With that and the added AI hype, people began feeling far too optimistic for the market to follow:
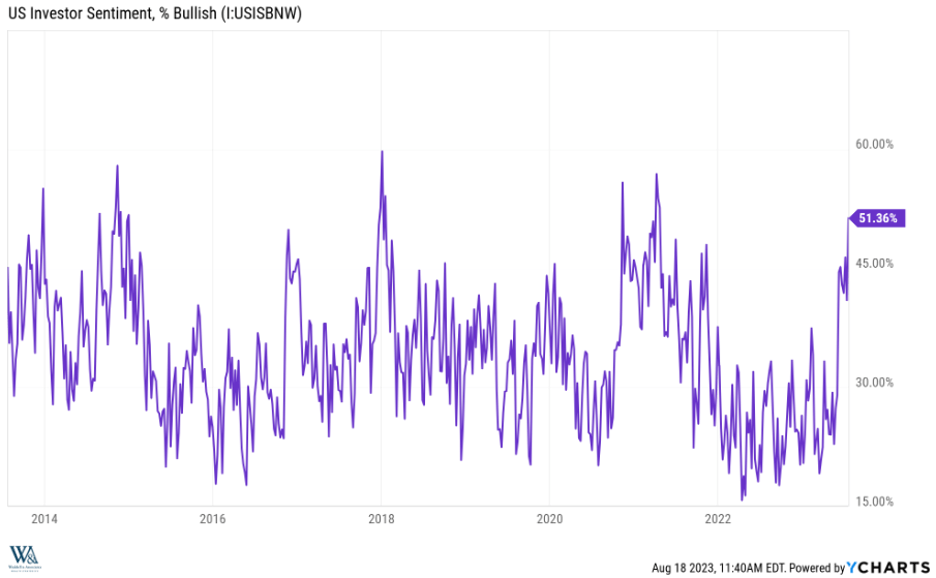
With seasonal softness and a sentiment reset on order, the stock market became a balloon in search of a pin as we entered August.
The Pin That Provides
Just as sentiment peaked in late July, long-term Treasury interest rates began a relentless run higher to cycle highs. The market did not anticipate this surge higher in yields as inflation readings continue to arrive below expectations. However, it’s important to separate the behavior of short-term bond yields that are more sensitive to economic releases and Fed policy proclamations, and long-term bond yields that depend more on supply and demand dynamics. While the 10-year treasury yield has spiked .53% over the past three weeks, the 2-year treasury yield has only spiked .20%. Additionally, the futures market probabilities of a Fed rate hike in September and November continue to be low and haven’t changed while interest rates have risen. So, what’s driving rates higher?
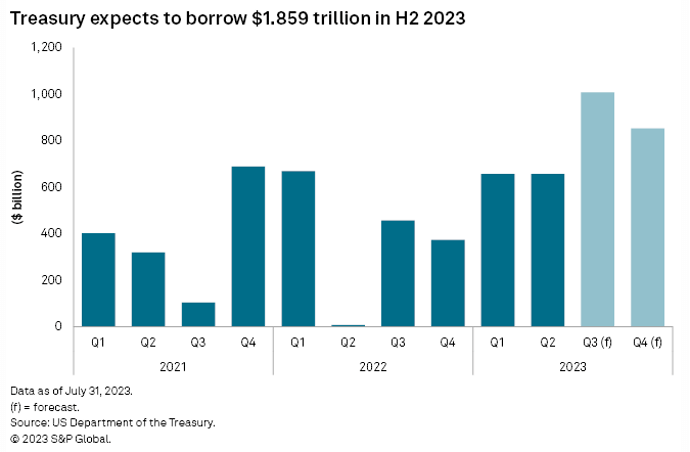
Annualized Federal Government receipts (taxes) have fallen from a peak of $5.1 trillion mid-2022 to $4.7 trillion. Simultaneously, annualized Federal spending has increased from $5.8 trillion to $6.5 trillion. Currently, the CBO estimates a budget deficit of 6% of GDP compared with 5% last year. In other words, tax revenues at 18% of GDP cannot fund government spending at 24% of GDP, which forces the US Treasury to auction LOTS of Treasury bonds.
Unfortunately, the US Treasury isn’t the only institution selling Treasury bonds right now. Remember that the US Federal Reserve has an automated sell-off/roll-off program approximating $100 Billion a month it calls, “quantitative tightening”. Additionally, the Japanese central bank has allowed domestic interest rates to drift higher, removing some domestic incentives to yield seek abroad. The Chinese have also intervened in their currency market by selling dollars (housed in Treasuries) to buy yuan.
On the demand side, banks have become more reticent to stockpile longer-dated maturities after the “duration” failures of SVB and First Republic. Further denting confidence, Fitch downgraded US Treasuries from AAA to AA+ citing political dysfunction. On that note, Government shutdown theatrics could soon resume. A reluctant House has until October 1st to pass 12 appropriations bills. In short, the supply/demand imbalance for Treasuries has led to sharply higher yields, fostering immediate downward pressure on stock market valuations…
…providing the perfect pin to deflate inflated investor sentiment.
Structural vs. Seasonal
While recession fears have receded, inflation fears have not resurged. In fact, most economists and rate forecasters expect the next Fed policy move will be to lower rates sometime in early 2024. Inflation break-evens also remain subdued, reinforcing our belief that the surge in rates relates to the surge in supply, not a surge in re-inflation angst. Second quarter corporate earnings season surprised to the upside as expected, and things should get much more constructive from here:

As such, we do not view this as a structural breakdown, but rather a seasonal drawdown required to reset sentiment and refuel the rally into year-end.
Enjoy your weekend!
David S. Waddell
CEO, Chief Investment Strategist