The Full Story:
The Fed’s 2% inflation goal represents the shorthand version of “normal” for the markets, but there are other critical markers of normal that require reclamation. With COVID economics under inoculation by the Fed, let’s examine the big three and see what we see!
Normal Nominal
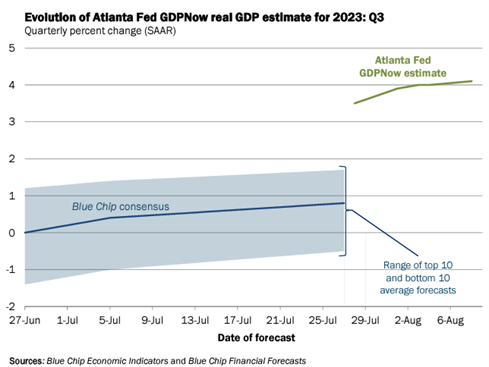
When measuring the pace of the US economy, most observers rely on inflation-adjusted changes in gross domestic product (real GDP). As we’ve noted in previous commentary, real GDP ticked higher in Q2 (+2.4%) and appears poised to tick higher again in Q3:
This certainly seems counterproductive, with the Fed summoning lower GDP growth to lower inflation. However, for a true appraisal of economic velocity, we must look at the pace of GDP without inflation adjustments (nominal GDP):
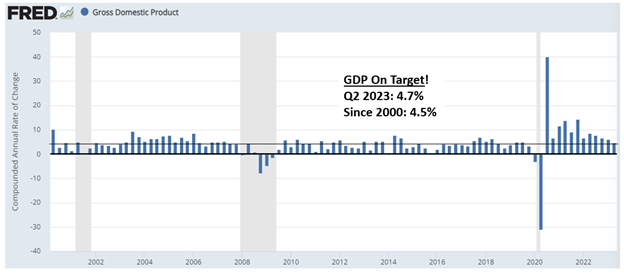
Nominal GDP has fallen consistently over the past year. This paints a much more comforting picture for the Fed as the nominal economy has slowed at a measured pace, assisting with its disinflation agenda. In fact, Q2 nominal GDP grew by 4.7%, roughly in line with its 20-year average of 4.5%. Normal nominal GDP levels should help normalize everything else.
Normal Inflation
On Thursday, we received further evidence of inflation’s descent as the Consumer Price Index for July rose .16% for the month. Multiply .16% by 12, and the annualized inflation rate falls below 2%. Most inflation reporting uses year-over-year numbers, which simply aggregate monthly movements. For July, the monthly move was .16% (encouraging), but the year-over-year change was 4.7% (discouraging). Don’t fret! Of the 12 monthly changes that aggregate into the annual number, August and September of 2022 caused most of the trouble:
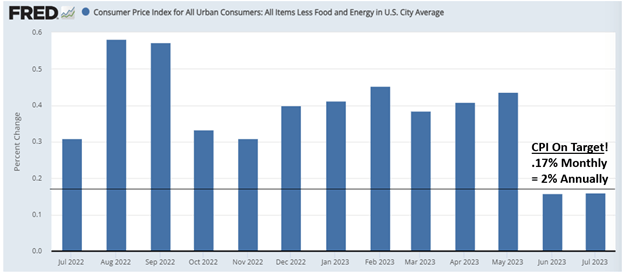
August and September will fall off the rolls in the upcoming months. The elimination of these “base effect” distortions will lead to a cascade lower in core inflation from 4.7% today to below 3.5% by year-end.
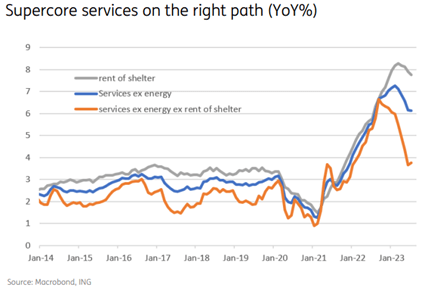
Lastly, housing inflation accounted for 90% of the monthly increase in July. As we have discussed, housing disinflation lags because renters and homeowners infrequently vacate and reprice properties. The Fed acknowledged this dynamic early on by directing attention to “supercore” inflation (services inflation less food, energy, and housing). For July, “supercore” inflation advanced .2% as well and will benefit from the same base effect evaporation as core inflation as we approach year-end.
Altogether, we remain convicted that the Fed should not, and will not, raise rates further and that inflation has locked onto a glide path toward normal.
Normal Rates
Just as inflation changes have distorted GDP measurement, they have also distorted interest rate behavior. Remember, near-term interest rates key off Fed policy decisions, while longer-dated maturities key off economic expectations. Pandemic inflation forced the Fed to raise near-term rates to 5.25%, a 22-year high! But longer-term rates reside within normal ranges:
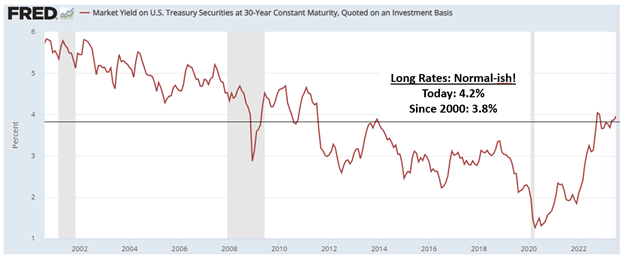
For most observers, a 4% interest rate on ten or 30-year Treasury bonds feels abnormal. But in truth, 4% is far more normal than the negative interest rate world we inhabited last decade:
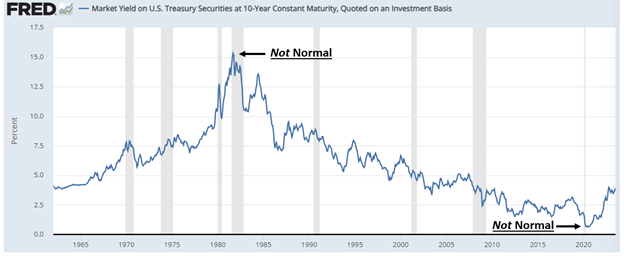
In fact, for most of our history prior to shunning the Gold Standard (designed to eliminate inflation), long-term US interest rates vacillated around 4%. So, while 4% may not feel normal to us today, it feels quite normal to history.
The pandemic economic era is winding down, and major economic indicators are resuming normal operations. While recency bias may keep investors on edge for some time, normal levels of economic activity should result in more normal levels of market activity… and less abnormal anxiety for investors!
Have a great weekend!
David S. Waddell
CEO, Chief Investment Strategist