The Full Story:
This week the Federal Reserve paused its interest rate hiking campaign while tightening its rhetoric. The algorithms sold the bark aggressively, with immediacy, while the humans bought the lack of bite aggressively, with delay. By the end of the week, the S&P stood 3% above where it began. For investors clinging to their pessimism like rosary beads, this rally has become excruciating.
The second quarter ends in two weeks with the S&P now up 16% on the year. Clients will open statements expecting returns. Pressures will mount upon pessimistic professionals to either double down on their pessimistic forecasts or capitulate. Within the past two weeks, the economy has shown resilience, inflation has slowed substantially, the Fed has hit pause, and forward earnings estimates are rising. While this market has become highly technically overbought, pullbacks will provide cover for capitulators, likely limiting their severity. But where will the money go?
Beyond the Hype
Despite the hype, those now entering the stock market supermarket will find some surprising bargains. They will not find them in the AI aisle, but they will find them nearly everywhere else. Consider the following valuations across investable market segments along with their year-to-date returns:
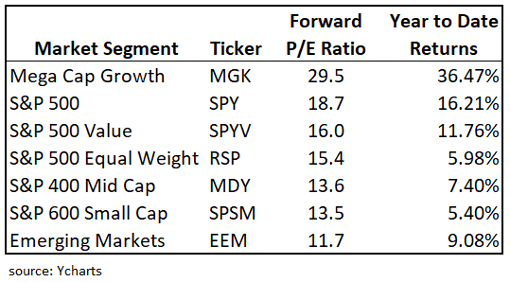
The valuation and performance differential between the mega cap driven S&P 500 and the non-S&P 500 segments provide ample mean reversion opportunities. For the mean to revert, either the megas need to catch down, or the rest of the market needs to catch up. Given the revival in economic and earnings confidence over the past couple of weeks, the catch-up trade has cause and traction. Note the June performance for the groups above:
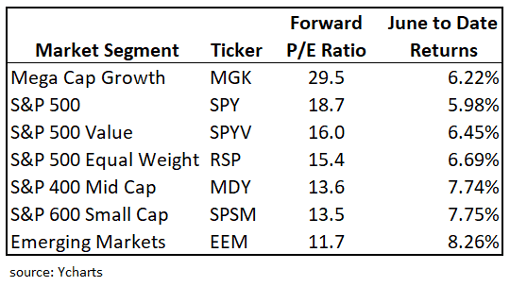
For those who feel they may have “missed it”, the valuations and trailing returns for the non-S&P 500 segments appear anything but frothy. Should recession severity fears abate, the rise of the rest provides plenty of opportunity for capitulators to get involved.
The Dis-Inflation Motivation
Tuesday’s Consumer Price Index release buoyed the market and cemented the Fed. As a huge fan of symmetry, I thought I would share this chart:
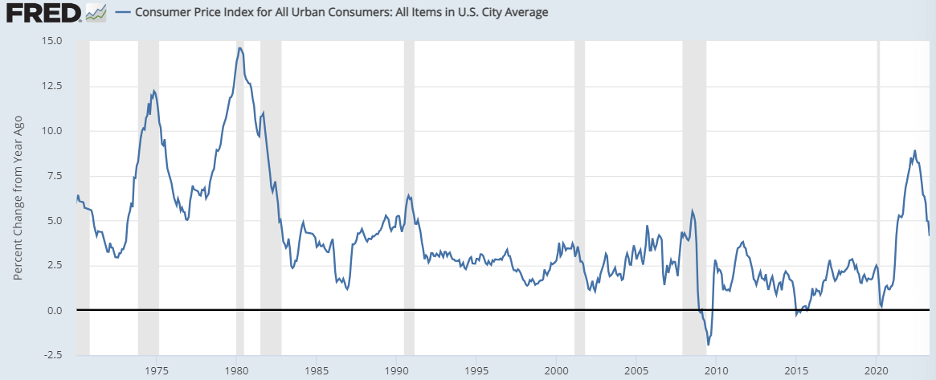
This chart chronicles the annual change for the Consumer Price Index over the last 50 years. Note that inflation never tends to hang around at highly elevated levels. On their own, higher prices crush demand which, in turn, leads to lower prices. Additionally, the Federal Reserve has a constitutional obligation to vigorously manage price levels. The combination of the two makes the persistently elevated inflation called for by the pessimists unlikely and historically unprecedented. Even in the 1970’s when the Fed had no experience managing money due to the recently terminated gold standard, peak inflation levels led to symmetrical troughs. The chart below chronicles the annual change in money supply (M2) going back to 1960:
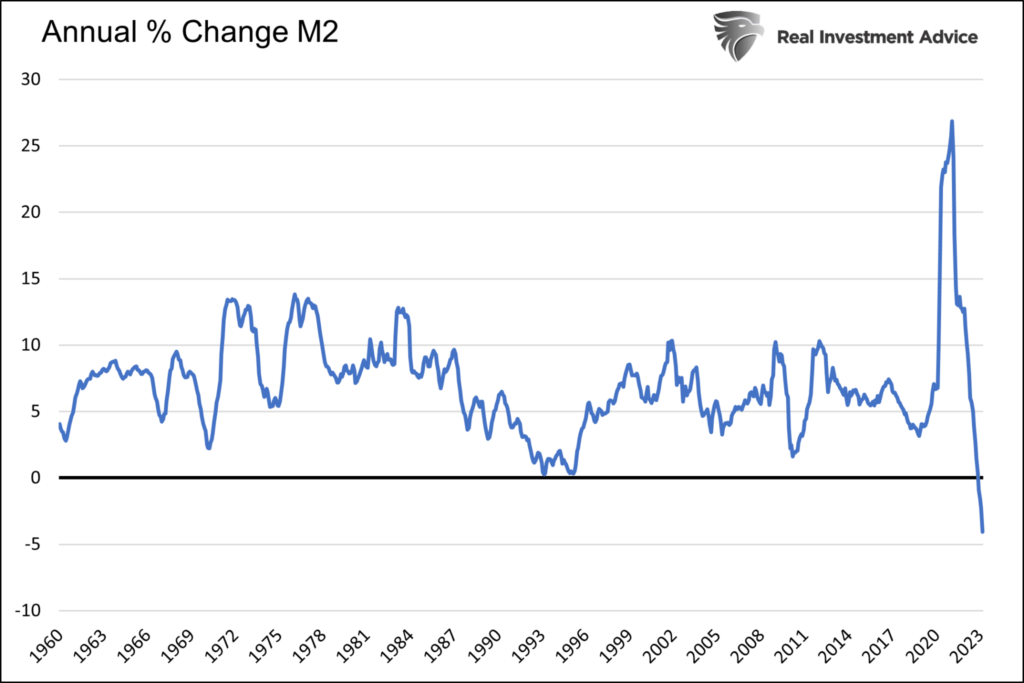
Note the roughly 10% annual growth for US money supply in the 1970’s. This monetary mismanagement led to higher-than-average inflation rates for a decade. Even still, while average levels were higher, the inflationary spikes seen in 1975 and 1979 corrected symmetrically. Fast forward to today. COVID stimulus policies led to an astounding 30% growth rate for US money supply. But unlike in the 1970’s, this policy profligacy rapidly reversed.
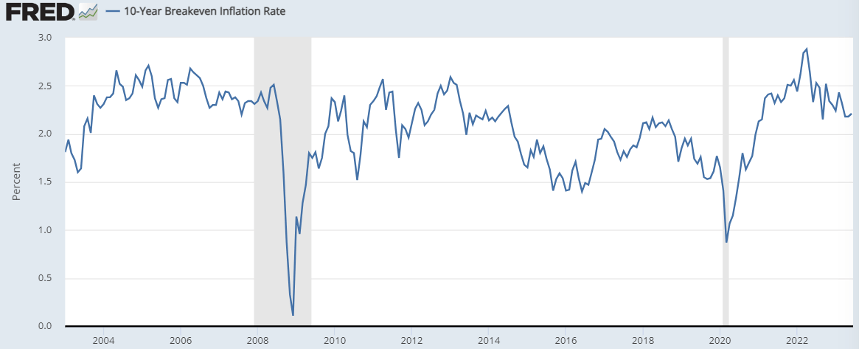
US money supply is now shrinking for the first time since the Great Depression. As a result, inflation has fallen even faster than it climbed. It took 14 months for this cycle’s inflation to climb from 4.1% to 9% and only 11 months for inflation to fall from 9% back to 4.1%. We will likely see 3% inflation in June, a level we haven’t seen since March of 2021. And just to further validate my simplistic “what goes up must come down” inflation hypothesis, markets agree, placing the 10 year forward inflation breakeven rate right at the Fed’s target of 2.2%:
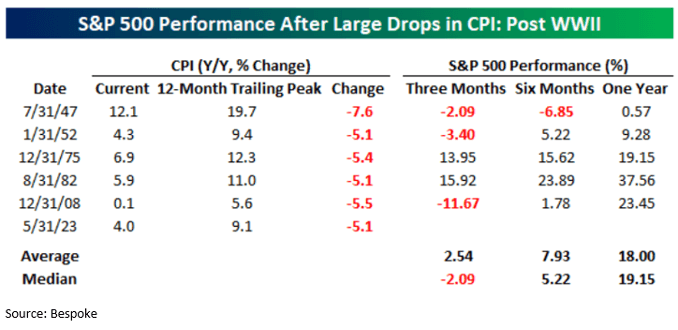
My point here is that inflation’s downward momentum has taken hold and inflation will continue to fall. It’s both science and policy at this point. And historically, periods of rapid disinflation have been followed by periods of robust investor returns:
Have a great weekend
David S. Waddell
CEO, Chief Investment Strategist