The Full Story:
The Dow Jones Industrial Average rallied 1200 points on Thursday for its sixth largest single day point gain in history. A lower-than-expected inflation reading provided the spark, while low investor sentiment levels and high investor cash levels provided the fuel. But this rally has more than one positive inflation report at work. Recent developments have created a high degree of FOMO (Fear of Missing Out) for cash heavy investors. Let’s review just a few of the reasons why.
Election Disinflation
On Tuesday of this week the Republicans won back the House of Representatives, thereby ending the $5 trillion spending spree since the last election. This resolves the conflict between loose fiscal policy and tight monetary policy, removing a key inflationary rift. This also places singular pressure on the Fed to navigate tightening policy without inciting a credit crisis. In the event of a credit crisis/severe recession, a gridlocked Congress becomes less reliable as a bailout mechanism for the economy. The go it alone Fed must now take this into account as they consider degrees of restraint.
‘Tis the Season
Markets prefer divided government. Historically the combination of a Democratic White House and a divided Congress results in average annual returns of 13.6%.
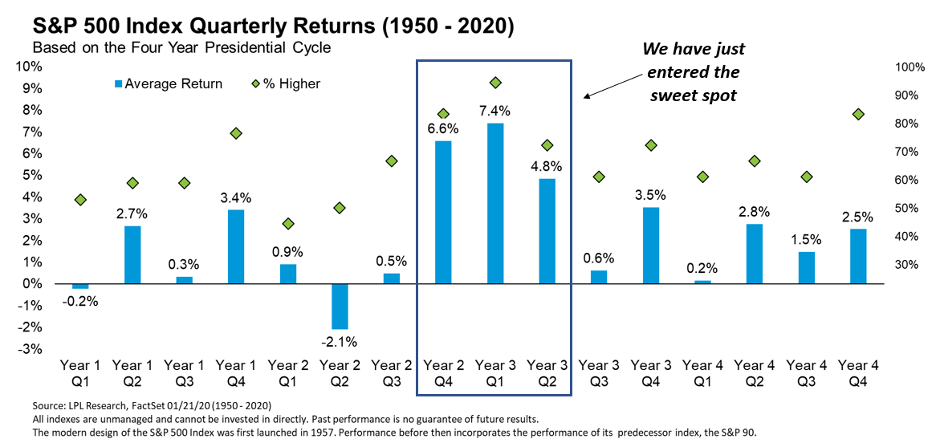
The third year of a presidential term provides the highest returns of the four-year cycle. On average, the stock market has returned 16.8%. Breaking this down further, average returns for year 2 quarter 4 (where we are now) are 6.6%, year 3 quarter 1 are 7.4% and year 3 quarter 2 are 4.8%.

Over the last 18 mid-term election periods, 18 had positive returns with markets 15% higher over the next year, on average.
According to the Stock Trader’s Almanac, we have just entered the strongest 6-month period for equity returns. Between November and April, stock markets have returned 7% on average and vault higher 80% of the time.
Investors who focus on probabilities rather than possibilities will recognize that the above data array constructs the strongest seasonal case possible for owning equities now.
The Inflation “Pivot”
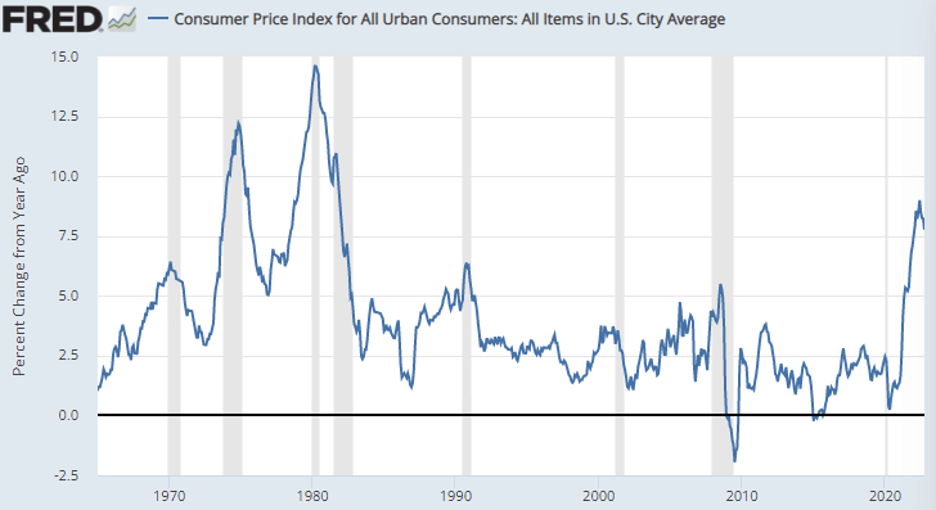
Thursday’s cooler CPI data surprised investors. Within the report, goods prices dis-inflated faster than expected. Used car prices, for instance, fell 2.4% last month. Apparel prices fell as well, indicating that we may have finally entered the downslope from stimulus. An increase in rents offset these declines, but rents lag housing prices by months and housing prices began falling in August. Added together this introduces the “risk” that inflation may decelerate faster than expected. Not only is this possible, but it’s historically probable. Consider the rapid down slopes following peak CPI readings going back to 1948:

The reason I say “risk” that inflation may decelerate faster than expected is because up until Thursday’s inflation report the “risk” was that inflation would be higher than expected for longer than expected. Yes, I know one number does not make a trend, but the mere introduction of a counterpoint led to massive repositioning as the stock market surged, treasury yields plummeted, and the dollar collapsed. Attention paid to the Fed policy pivot always seemed backwards to me, as it’s the inflation pivot that matters more, since the Fed clearly operates with a lag.
A More Patient Fed
At the last FOMC meeting, Chairman Powell laid out a three-dimensional framework for future rate decisions. The first dimension was speed which he signaled could slow from .75% in November to .50% in December. The second dimension was height, which he signaled could rise above 5% by March of 2023. The third dimension was length where he suggested holding rates higher for longer. The Dow fell over 800 points in response. But wait. The Fed said it will slow the pace of rate increases. That’s suddenly positive. If inflation falls faster than expected from here, it’s likely that they will not have to raise rates as much as projected nor for as long as projected. A slowing pace of rate hikes means more opportunity for inflation to surprise positively between hikes, as it did on Thursday.
Fallings Dollars = Softer Landings
The U.S. dollar index peaked at 114 on September 28th. It closed on Friday at (106). A 7% decline may not sound like much, but this change in direction after a relentless run removes significant financial stress worldwide. A lower dollar means a lower chance of an international credit event. A mild recession (already priced in) poses little threat to investors. But a recession and a credit event (not priced in) could inflict significant 2008 like damage. As the dollar declines, so does the risk of a “hard” landing.
Laws of Valuation Attraction
The S&P 500 trades for 16 times earnings. 100 companies within the S&P 500 trade for less than 10 times earnings. The S&P 400 mid-cap index trades at 12.5 times earnings. The S&P 600 small cap index trades for 11.7 times earnings. The international markets collectively trade for 11.4 times earnings. The emerging markets trade for 10 times earnings. Simply put, outside of U.S. technology names, stocks are cheap. History rewards investors “brave” enough to buy stocks at low valuations rather than high ones.
Taken together, favorable mid-term results, strong seasonality, lower inflation, dollar declines, Fed policy patience, and low valuations activated massive investor FOMO on Thursday. Will it persist? Unclear. But the odds of October 14th marking a meaningful bottom grow greater every trading day.
Have a great Sunday!


