The Full Story:
Despite the Fed’s best efforts, the unemployment rate fell in September to cycle lows of 3.5% as United States employers added 263,000 additional workers last month. This further postpones any dovish policy pivots as the Fed will remain resolute until the labor market softens. The tick lower in the participation rate (adults working or job hunting), falling 57,000 to 62.3%, reversed an encouraging trend as a growing labor force reduces wage pressures.
Having employers hire fewer people while the number of people looking for work declines has a self-canceling effect. Wages rose 5% over the past year, down from 5.2% in August. Overall, despite the 3.5% unemployment rate, the underlying data does show cooler trends, but not at a pace meaningful enough to cool the Fed.
Unless the Consumer Price Index report on October 13th surprises dramatically to the downside, the Fed will hike rates .75% on November 2nd. To ensure market preparedness, the Fed has been trotting out droves of speakers to reinforce their commitment to hike rates up to 4%-4.25% by year-end, with perhaps another rate hike slotted for January. Markets conceded with the two-year Treasury currently yielding 4.3% as an approximate proxy for the terminal Fed funds rate.
The resilience of the labor market likely reflects concern among employers that labor shortage issues will only intensify in the future. Fair enough, given the work-from-home demands, saving money by laying off surplus real estate makes more sense than saving money by laying off scarce labor. Employers’ battle plan for recession 2023 means that layoffs could be further down the priority list than in the past. To test this theory, consider the following trends in the Job Openings, and Labor Turnover report released earlier this week:
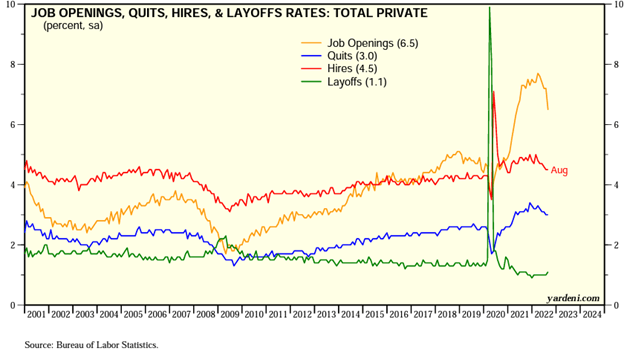
In August, layoffs ticked marginally higher, but job openings collapsed. In other words, this “you can stay, but your friend can’t come” trend may result in a hard stop to hiring without matching enthusiasm for layoffs. In sum, cracks in the labor market have appeared, but fears of persistent labor shortages may prolong the Fed’s desired adjustment, making the appropriate investment strategy… patience.
Oncoming Pivot Pointers
Over the last week, a smaller-than-expected rate hike from the Reserve Bank of Australia, a reversal of policy in Britain from quantitative tightening to quantitative easing, and interventionist activity from China to support the Yuan previewed the “dovish” Fed pivot investors anxiously await. Let’s survey reactions worldwide from most recent bottoms to most recent tops for clues of what a more durable rally may resemble:
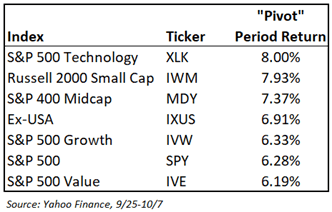
Often in bear market rallies, those that fall most rise first. Clearly, technology has borne the brunt of this year’s declines, being most sensitive to rate movements. Over the “pivot” period, the yield on the 10-year Treasury fell from 3.97% to 3.62%, offering valuation relief for higher valuation technology shares, placing them first in our roster of returns.
Anticipation of less economic downforce from central banks also offered relief to lower capitalization areas like mid-caps and small caps with more economic elasticity, placing them second and third in our roster of returns. The U.S. dollar has been the largest beneficiary of Fed aggression, having risen an astonishing 17% year to date. Over the “pivot” period, the dollar index fell nearly 4%, adding a currency tailwind to international shares, placing them third in our roster of returns. Investors prepping their “pivot” playbooks should use time periods like this to “beta test” allocation decisions.
The Dollar Denominator Distortion
Those looking for a really fun, free database of global returns,
Click Here
. MSCI tabulates stock market returns globally, providing analysts with numbers denominated in U.S. dollars as well as local currencies. When contemplating global investment performance, outsized currency moves lead to serious distortions in investor perceptions. Consider the following returns for global markets in U.S. dollars and local currencies year to date, ranked first by U.S. dollar-based returns:
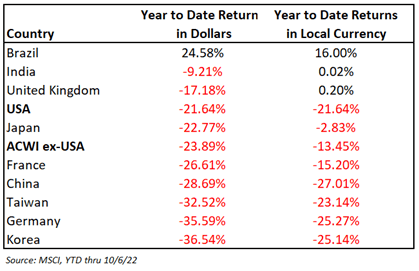
Without getting into the “Why’s” in this sub-set, Brazil, India, and the UK have outperformed the USA, denominated in U.S. dollars, while the rest of the world has underperformed. Now, let’s look at the same subset ranked by local currency returns:
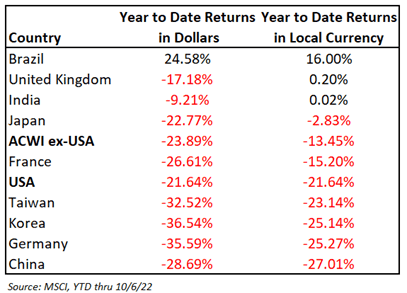
When adjusting for currency, Brazil, the UK, India, Japan, and France have all outperformed the USA. In fact, so has the ACWI-Ex USA (Global stock index minus the USA). In local currency, the world outside of the USA has fallen 13.45% in 2022 versus 21.64% inside the USA.
So, has the U.S. stock market outperformed in 2022, or has the U.S. dollar? The answer is the U.S. dollar!
Up nearly 20% year to date, the dollar is having one of its most explosive moves in history:
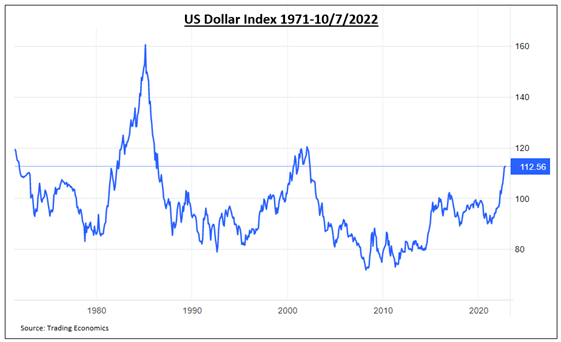
The Fed has told us that it expects to conclude its rate hike regime in the first quarter of 2023. Based upon the recent “Pivot” rally, this foretells a lower U.S. dollar for 2023. Should that manifest, international equities, which have outperformed in local terms this year, will likely outperform in dollar terms next year. While it may make no sense to investors to allocate to war-torn Europe and China-led Asia, their combination of rock bottom valuations and rock bottom currency values makes the Ex-USA trade, perhaps, the most interesting trade for 2023.
Have a great Sunday!


