The Full Story:
The COVID stimulus-response awoke inflation. Russian aggression aggravated inflation. Deglobalization trends have augmented inflation, while energy legislation preferences have established inflation susceptibilities. Consequentially, US consumer prices have risen 7.9% over the past twelve months. For the average consumer, this translates into a monthly inflation premium of nearly $300 according to Moody’s analytics, causing us to question… with the price of everything apparently on the rise, can the US consumer afford this inflation?
The State of The US Consumer
To evaluate whether US households can absorb an 8% price hike, we need to examine household income and balance sheet dynamics. I apologize in advance for making this week’s missive chart heavy, but I believe the visual trendlines will help with absorption. Let’s start with personal incomes:
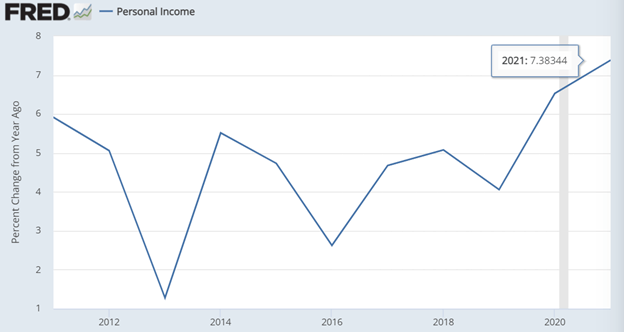
Over the past year, household incomes have risen 7.4%. That is the fastest rate of growth for incomes in 20 years despite COVID and recession assaults, thanks to gargantuan government stimulus. While households increased spending levels, they didn’t squander their rewards. Have a look at current debt and debt service levels:
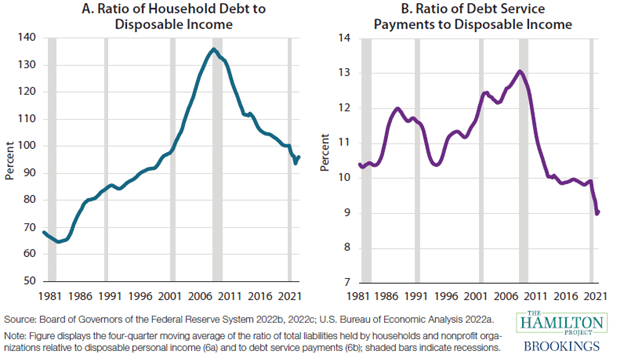
Households cut debt levels significantly last year, on-trend since 2008. In fact, since 2008, households have reduced debt service burdens by 30% of their disposable income (income less taxes). Given current per capita disposable income levels of $55,000, a 30% reduction in debt service levels essentially frees up $2,200 a year to help offset inflation. As added inflation insurance, check out the accumulated savings currently pooling inside household checking accounts:
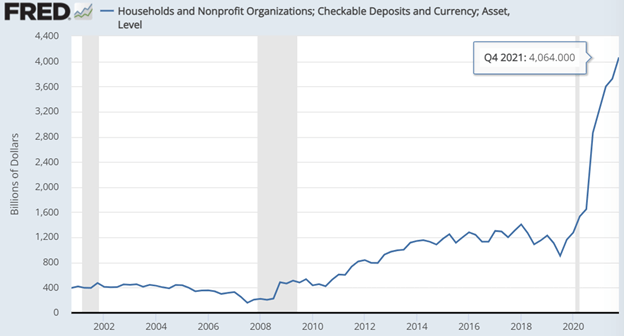
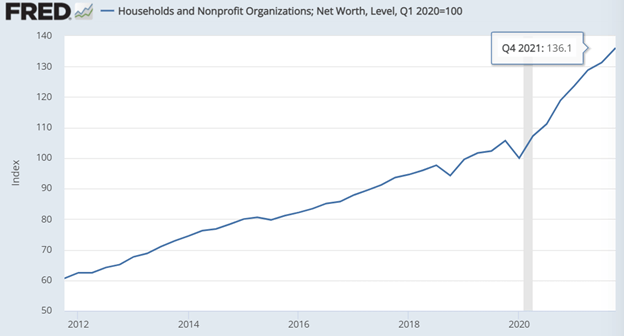
Households have accumulated an extra $3 trillion in their checking accounts since COVID began! And the windfall funds that didn’t go to fund more consumption, reduce debt burdens, or accumulate in cash, found their way into highly productive investment assets. As seen below, household net worth has grown 36% since COVID began to an astounding $150 trillion or 6.5x total US GDP!
Also, while I hate spending $100 at the pump to fill up my SUV, it is important to maintain perspective on how much consumers spend on gas and energy overall as a percentage of disposable income:
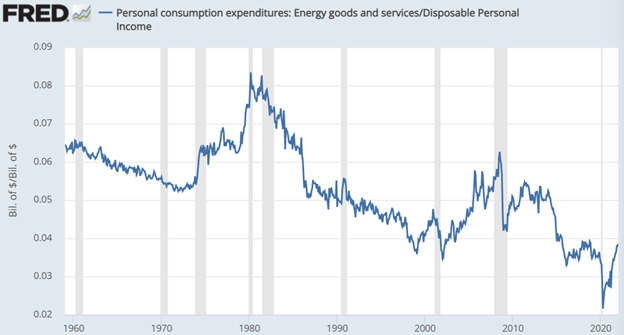
During the 2008 spike in oil prices, consumers were spending over 6% of their disposable income on gasoline and energy. Today, consumers are spending roughly 4%, well below 2008 levels and more than 50% below 1980 levels. It hurts, but in the grand scheme of things US consumers spend relatively little at the pump.
Lastly, should savings dwindle, US consumers have plenty of employment opportunities to choose from. There are currently 11.3 million job openings across the US economy. The employment participation rate has risen recently but remains a full percentage point below pre-pandemic levels. Two million fewer Americans are working today than in February of 2020. If US consumers need more income, they have plenty of opportunities to seek more employment.
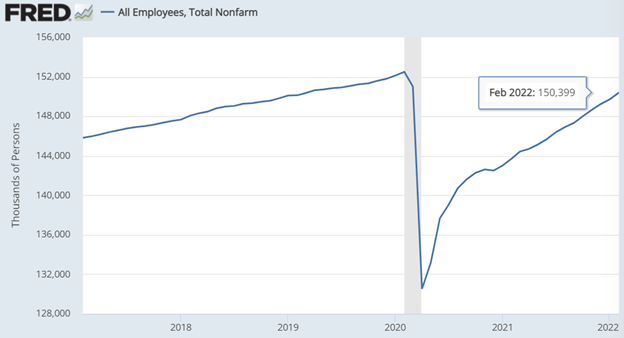
In sum, US household finances have never looked better! Personal income growth over the past year kept pace with inflation. Debt service levels have fallen to historic lows, freeing up disposable income. Checking and investment accounts have swollen well above pre-pandemic levels, and the US economy continues to add jobs and income at a torrid pace. Therefore, while inflation may harass consumer finances, income statements and balance sheets stand well-fortified to withstand the assault. The excessive stimulus programs deployed to offset COVID now seem more than enough to offset Vladimir Putin as well. Advantage, US consumer.
Have a great Sunday!


