The Full Story:
In keeping with the current “world turned upside down” theme, this week I will not discuss the stock market and will instead turn my attention to the bond market. Those who follow us regularly know that we rarely focus on the bond market in these missives because, well, bonds are boring. But, in truth, bonds should be boring. Bonds should generate a positive return and act as portfolio insurance. If you find life insurance boring, you should likewise find portfolio insurance boring. Periodically, however, bonds become NOT boring. These moments presage or correlate with larger economic and credit disturbances like the Savings and Loan Crisis, the Asian Financial Crisis, the Great Recession, and the Euro Crisis. Each of these crises roiled credit markets and inflicted significant damage on bond holders by invalidating their portfolio insurance. With the world swiftly and involuntarily restructuring due to the crisis in Ukraine, we need to audit the bond market to properly appraise the alarm and ensure that our insurance holds.
The Yield Curve
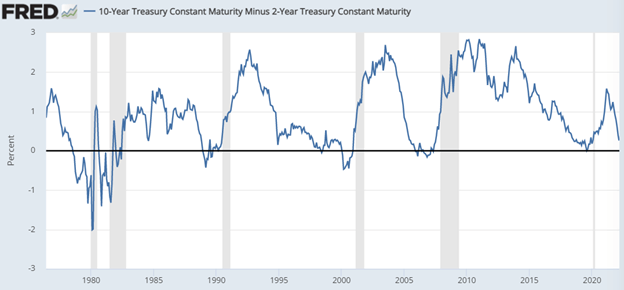
The Federal Reserve sets short-term interest rates but not long-term interest rates. Market forces set long-term interest rates based upon assessments of future economic growth, inflation, and Fed policy. As economic cycles age, inflation pressures typically rise, leading the Fed to increase interest rates. As they do, tighter monetary policy reduces economic growth expectations, leading to lower long-term interest rates. This higher short/lower long rate shift can invert the yield curve, stripping banks of their incentive to lend money at rates lower than they pay on deposits. At this point, credit extension ceases, and recessions typically follow. To assess our location within the economic cycle and the threat of oncoming recession, we need to look at yield curves.

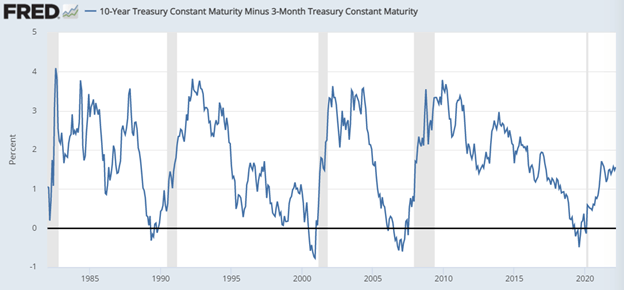
Currently, the spread between the 10-year Treasury yield and the 2-year Treasury yield sits at .26%. The speed of the curve flattening has been swift and concerning, but this yield curve measure contains assumptions about future Fed policy rates. The current 2-year Treasury yields 1.63%, up from .15% this time last year. Therefore, the two-year Treasury projects roughly six .25% rate hikes over the next two years. But, if that is true, then we likely have a growing economy for the Fed to raise into. This could lead to higher growth expectations and a rising 10-year yield as well, which would re-steepen the curve (ala 1995). For a purer look at the Fed’s policy rate vs. the market’s rate, we need to look at the 10-year Treasury yield minus the 3-month Treasury yield.

By this measure, the curve has an early cycle appearance, not a late cycle appearance. The Fed has committed to raising rates .25% next week, so the slope will flatten some, but until this curve inverts, the recession odds are low.
High Yield Credit Spreads
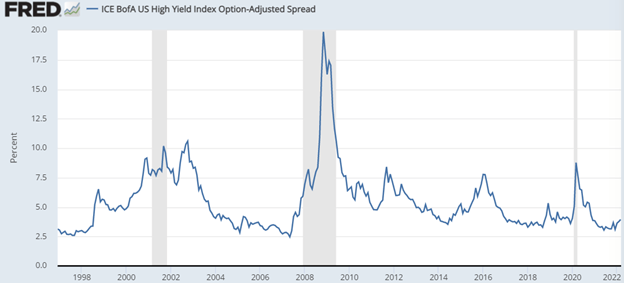
While our yield curve analysis for the moment dispels recession fears, we need to evaluate corporate credit conditions as well for signs of stress. When corporate conditions deteriorate, downgrades and defaults lead corporate bond holders to demand higher yields in exchange for higher risk. If we compare the yields of “risk-free” Treasuries with the yields of “high-risk” corporate bonds, we can measure corporate credit confidence.

While yield spreads have widened recently, they remain far below levels reached during the Dotcom, Great Financial and COVID crises. For the moment, corporate credit markets seem unconcerned.
Emerging Market Bond Spreads
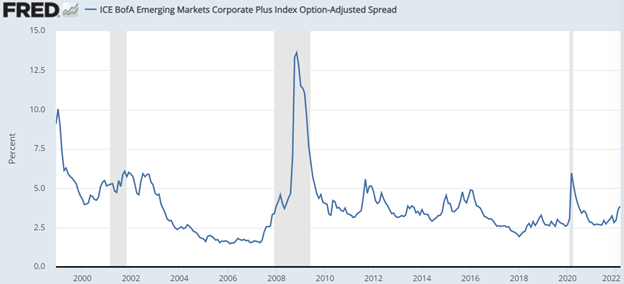
Our domestic markets seem to be shrugging off Putin’s pugnaciousness, but we need to check in on offshore markets to complete our appraisal. Just as spreads between high-yield corporate yields and Treasury bond yields measure credit stress, so do spreads between emerging market corporate yields and Treasuries.

Note in the chart above that credit spreads blew out to 10% back in 1998, the last time we had a Russian financial crisis. However, that crisis originated in Asia and the damage spread far beyond Russia’s technical default. Currently, spreads have widened, but only at a fraction of where they were in 1998. Remember, Russian debt resides within the emerging market index, but it is less than 1% of total weightings. Russia’s capital market reputation never fully recovered from 1998, limiting their current financial interlinkages.
In sum, Russia’s credit crisis… for the moment… appears to be theirs alone.
Have a great Sunday!


