The Full Story:
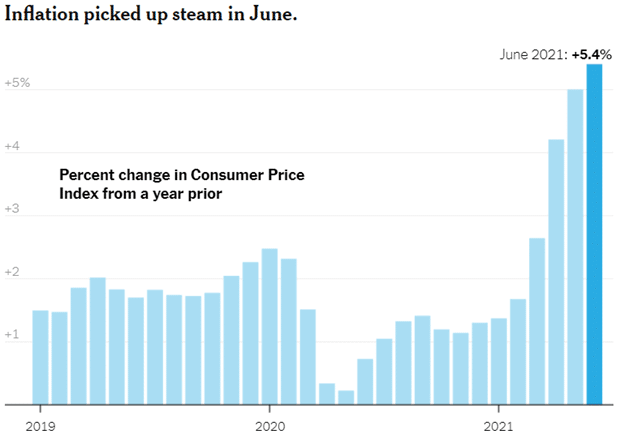
Chairman Powell spent two days this week testifying before Congress after releasing his mid-year Monetary Policy Report. This robust report details the current economic perspectives and future expectations of the FOMC (the committee that determines monetary policy). While the report and Chairman Powell assert that “all is well” regarding inflation, many marketplace participants and congressional leaders strongly disagree. On Tuesday, the Bureau of Labor Statistics released a somewhat startling Consumer Price Index measure for June:

In the words of Senator Toomey, “Inflation is here, and it’s more severe than most, including the Fed itself, expected. Since the Fed has proven unable to forecast the level of inflation, why should we be confident that the Fed can forecast the duration of inflation?”. Good question.
The Fed’s Purpose
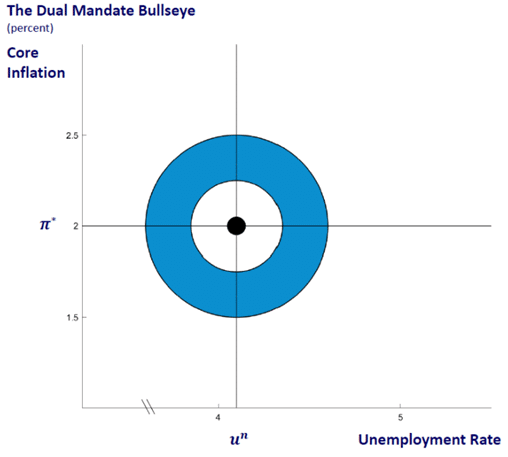
Remember that Congress has given the Fed two jobs. First, they must pursue policies that promote “full employment”. Second, they must pursue policies that promote “price stability”. All their thinking and commentary calibrates with the bullseye in the image below:

Currently, the US unemployment rate stands at 5.9%, up from 3.5% pre-pandemic. That number has fallen swiftly from the 14.8% rate reached in April of last year, but other employment measures have been less cooperative. The labor force participation rate stands at 61.6%, down from 63.3% pre-pandemic. That may not sound like a lot, but taken overall, America employs 145 million laborers today compared with 153 million laborers pre-pandemic. Meanwhile, US GDP has fully recovered. More GDP per worker means more economic productivity, and that’s great! But seven million Americans not working today who were working a year ago is not great. The Fed has not met its full employment congressional mandate, justifying its continued and aggressive monetary policy.
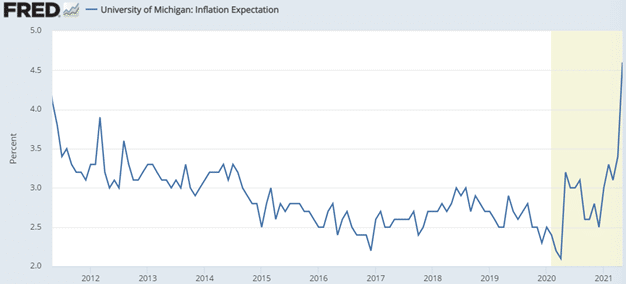
Congress also mandated that the Fed pursue policies that maintain “price stability”. The Fed has defined price stability as core inflation levels “moderately above 2% for some period of time”. With the most recent CPI clocking in at 5.4% and the Fed’s preferred measure at 3.4% (May release), the Fed has clearly incited inflation well above target. This would suggest that its aggressive policy stance of 0% interest rates and $120 billion per month of money printing and securities purchases might warrant review. Furthermore, over the next year, inflation expectations as measured by the Michigan Inflation Expectations Index stands at 4.6%, up from 2.5% pre-pandemic:

If inflation runs anywhere near these levels over the next year, the pressure on the Fed to adjust policy will only grow more intense. With inflation clearly exceeding the Fed’s self-stated objective, why the reticence to tighten policy?
The Consumer Price Index leapt 5.4% in June, which was the largest month-over-month increase in nearly 15 years. That’s a nasty headline for the Fed. However, breaking down the report, there are some situational anomalies. First, economists usually eliminate the food and energy measures due to their short-term volatility. Over the long-term, the CPI and the CPI-ex food and energy harmonize, but over the short-term, including food and energy increases index volatility by a factor of 7. Over the last 12 months, the food index rose a benign 2.4%, but the energy index rose 24.5% powered by a 45% rise in gasoline prices. Removing the food and energy components produces a “core” CPI inflation rate of 4.5%.
Let’s keep digging.
For a more accurate read, we also need to adjust the index for “base” effects. Prices actually declined during the beginning of the pandemic due to the economic shock. If we bring prices back to pre-pandemic par and then measure the year-over year increase, the core inflation rate falls another .9% to 3.6%. From there we can examine the subcomponents to identify the major contributors. By far the largest price increases within the index stem from car shortages. Over the past year, used car prices have increased 45.2%. Given that used cars receive a 3% weighting within the index, the spike in used car prices ALONE accounts for nearly 1.5% of the change in CPI.
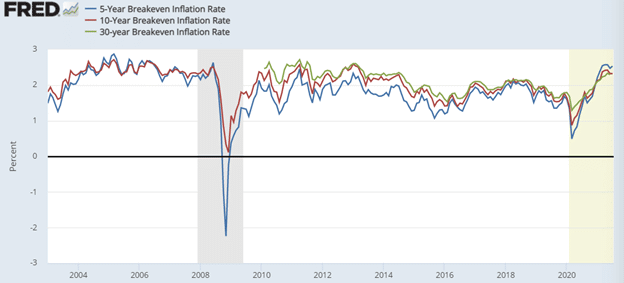
Other components that contributed heavily include airfares (up 25%), hotel rooms (up 17%), and car rental prices (up 88%). These components contributed another .5% or so to the CPI. Each of these industries was in heavy distress this time last year, distorting price comparisons. If we eliminate the pandemic year-over-year anomalies, the CPI registers near or below 2%, aligning with the Fed’s stated objective. From their perspective, we need to move beyond the “re-opening” period to properly assess inflation levels. In fact, when we look at investor’s inflation expectations 5, 10, even 30 years down the road, they gravitate toward the Fed’s objective:

By these measures, the Fed’s current policy stance seems appropriate and effective. Furthermore, outside the US, increasing Delta virus case counts and tightening economic restrictions could lessen recovery rates. Within the US, the wind down of COVID stimulus policies without a clear legislative pathway for further support could limit recovery rates as well. According to the Congressional Budget Office, the Federal deficit will decrease from $3 trillion this year to $1 trillion next year. That amounts to fiscal tightening, adding another headwind for the Fed to consider in addition to the labor and supply shortages across the economy. Taken together, it’s simply too early for the Fed to declare that its “moderately above 2% for some time” inflation objective has been met, justifying its continued, and aggressive, monetary policy.
Have a great Sunday!


