The Full Story:
Market prognosticators have endless data points to track, measure, and interpret. For instance, on Friday we received a disappointing jobs growth number for November. The recent resurgence in COVID cases and hospitalizations along with reimposed safety measures have led to a deceleration in hiring activity. In response, Congress has intensified its thumb twiddling. The market response? All-time highs. While the daily data releases add spices to the stew, the underlying base determines the flavor. The trick to improving accuracy over time (there are no perfect scores in fortunetelling) is knowing which variable will dominate and when. Therefore, I challenge myself all the time to choose a “desert island” indicator. In other words, if I am trapped on a desert island with only one chart, updating in real time, to properly position our investors’ hard-earned capital, which would I choose?
The three primary actors in the global economy are central banks, governments, and businesses. Governments influence the economy, primarily through fiscal policy. Cutting taxes, reducing regulation, and increasing spending = stimulus. On the other hand, increasing taxes, increasing regulation, and reducing spending = restraint. Central banks influence the economy through monetary policy. Cutting interest rates, printing more money, and purchasing assets = stimulus. Conversely, raising rates, printing less money, and selling assets = restraint. Businesses make decisions based upon confidence. More confidence leads to capital expenditures and hiring, which = stimulus. Less confidence = restraint. In the current environment, fiscal and monetary policies carry extra weight as uncertainty and marketplace disruption due to COVID continue to discombobulate business leaders. As such, we need an indicator that measures the will of central banks and governments to continue their sizable support efforts to stimulate this economy.
The Federal Reserve’s testimony in Jackson Hole at the end of August contained real insight into their thinking. The Fed believes that declining demographic trends (i.e., too few babies and too few new immigrants) in the U.S. impose a serious deflationary force upon the economy. For years, they have used their 2% inflation target as a limiter. Any upward trend toward 2% was met with more restrictive monetary policy. In hindsight, they recognize that their preemptive strikes against inflation overestimated the real inflationary threat. In response, they have inverted their inflation framework to consider 2% a suitable floor rather than a suitable ceiling. Therefore, the Federal Reserve will continue their stimulative support for the economy until expected and/or real inflation climb far higher than the tolerance levels of the past.
Congress and the White House have always sparred over suitable levels of public debt. Many believe that ballooning deficits saddle our grandchildren with unpayable bills. Others espouse that the Government can always pay its bills because it prints its own money. Over the past year, the federal debt level has ballooned from 105% of GDP as of September 30, 2019 to 127% as of September 30, 2020. Concurrently, inflation and interest rate levels have fallen. That is NOT how the textbooks read. Theoretically, more government debt should stimulate higher inflation and higher interest rates. But what if it doesn’t? If not, then the Modern Monetary Theorists are right. Without inflation as a limiter, the Government can spend whatever it wants, and deficits don’t matter. This view, justifiable or not, seems to hold the upper hand in Washington. Therefore, the Government will continue their stimulative support for the economy until expected and/or real inflation climb far higher than the tolerance levels of the past.
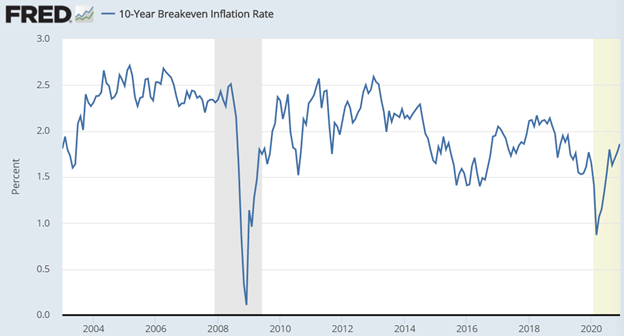
The two inflation expectations gauges that the Fed and the Congressional Budget Office monitor are the 10-year breakeven inflation rate and the 5-year, 5-year forward inflation rate. Without going into detail, these are market-based indicators relying on the hive mind of investors. Both indicators express where traders believe inflation will be 10 years from now. Let’s take a look at both:

As you can see, fixed income traders currently forecast an inflation rate of 1.86% 10 years from now. Note the steady decline in the slope of the line since 2004. This is the trend that unnerves the Fed. Also note the rapid decrease in inflation expectations that happened in 2019. Overtightening by the Fed in anticipation of inflation backfired, reinforcing their “loose for longer” strategy shift.
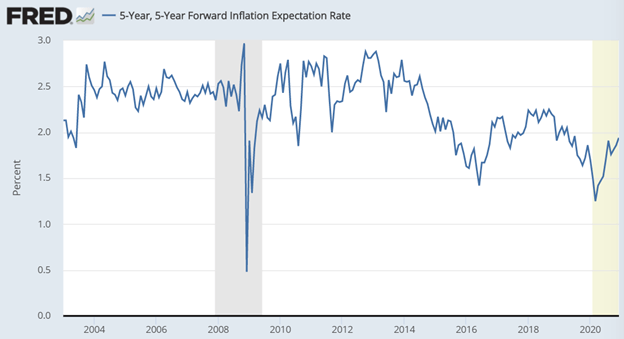
Now, let’s look at the 5-year, 5-year forward measure:

The charts reinforce each other. Both suggest a trend of lower expectations. Both also reveal rising inflation expectations from the morose levels earlier in the year. IF the Fed still relied on expectations to craft policy, these charts might suggest tightening conversations within the Fed. Furthermore, the run up in asset prices might cause some Fed members to advocate for a tighter policy stance to deflate rising bubble risks. BUT, because the FED has been burned on using inflation EXPECTATIONS to calibrate policy moves, I believe actual inflation measures will now direct Fed action.
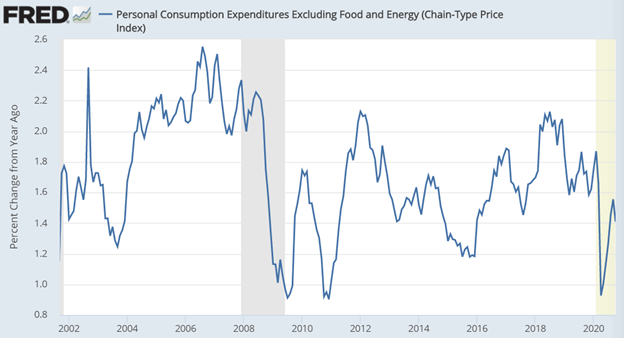
Here is actual inflation as measured by personal consumption expenditures excluding more volatile food and energy prices (Core PCE):

With the Federal Reserve now rooting for inflation of 2%+ and the Federal Government adopting “deficits don’t matter without inflation”, a current inflation rate of 1.5% foretells continued accommodation if not outright stimulus from both the Federal Reserve and the U.S. Government for the foreseeable future. As the vaccine distributes and economic brownouts end, business confidence will rise. The combination of the Fed, the Government, and businesses collaborating on higher inflation and higher economic growth amounts to a holy trinity of support for investors.
With the Federal Reserve and the Federal Government in tacit agreement that they will continue to provide monetary and fiscal support for the economy until ACTUAL inflation exceeds 2%, the Core PCE inflation measure becomes the most important indicator for investors to follow…and the one chart I would take with me to a desert island for 2021.


