The Full Story:
Someone asked me last month which indicator I would choose for orientation during the COVID crisis if I could choose just one. That’s tough. Candidates could include daily case rates, daily fatalities, the RO (R naught), the unemployment rate, the Dow, the US dollar, Treasury yields, Trump’s reelection odds or perhaps even gold. In selecting just one proxy indicator, I would need one that captures all the inputs, including health developments, central banking policies, fiscal policies, and economic direction. I’d also need one that’s easy to track and updates in real time. Let’s begin with the past. In the Great Recession, the banks were ground zero. For any recovery to gain credibility, the bank stocks needed to bottom. From the top, the S&P 500 Banking Index fell 85% between February of 2007 and March of 2009. Over the next two months, these same stocks rallied 165%, sounding the all clear. In the COVID crisis, small businesses are ground zero. Small businesses typically have lower margins, fewer financing options and less experienced leadership than large businesses. In a storm, it’s the S.S. Minnow that gets tossed about, not the U.S.S. Intrepid, and COVID is a class 5. How will we know when the storm has really passed? When the Minnows in our economy retake cruising speed.
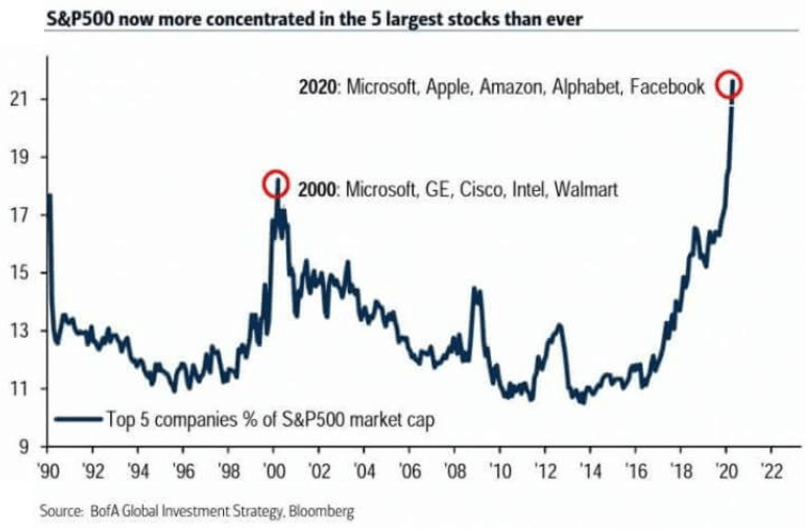
While I recognize the marketplace obsession with the S&P 500 index, Standard and Poor’s actually tracks over 1,800 different stock market indices surveying every imaginable cohort. The companies within the S&P 500 Index represent only the largest US companies, many of which have benefitted from COVID. In fact, some of the largest beneficiaries, Microsoft, Apple, Amazon, Google and Facebook account for more than 20% of the entire index:

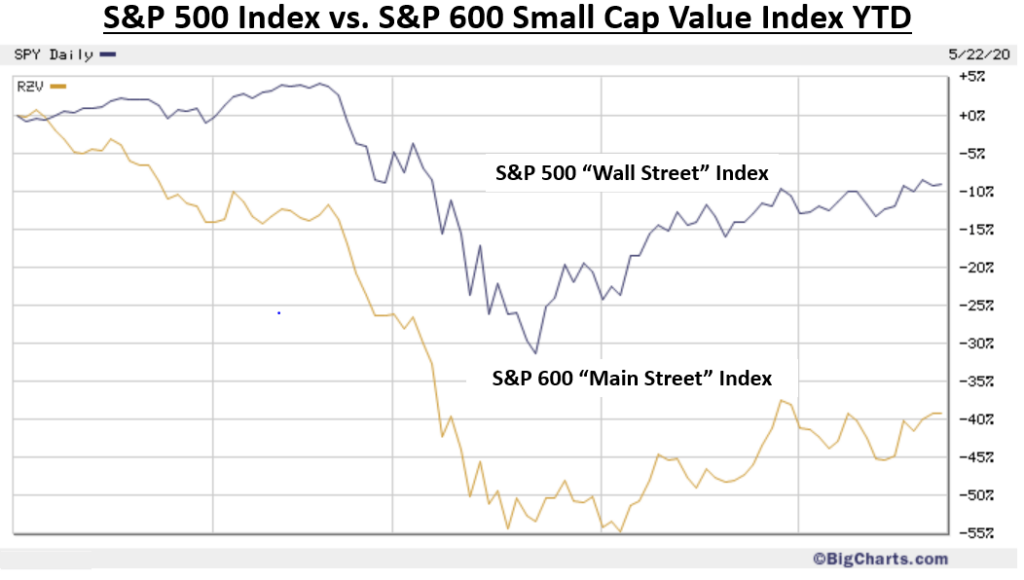
This explains the disconnect between the drawdown in the “economy” and the resilience of the “stock market”. The S&P 500 cap-weighted index communicates more about the health of big-cap tech than about the economy overall. To correct for these size distortions and better calibrate the “stock market” with the “economy”, an equal weight version of the S&P 500 exists. While the S&P 500 cap-weighted index has fallen a mere 9% this year, the S&P 500 equal weight index has shed a more COVID-like 17%. But even still, these larger “Wall Street” companies should have more in their survival kits than their smaller “Main Street” peers, suggesting more damage below.
The S&P 600 Small Cap Index contains 600 companies with market caps between around $500 million and $2 billion and has fallen 24% year to date. Recognizing that COVID has also benefitted some small stay-at-home technology and health care companies, locating a small-cap non-tech, non-healthcare index would provide the purest real time read on main-street conditions. Fortunately, Standard and Poor’s has an index for everything! The S&P Small Cap 600 Pure Value Index consists of 146 companies operating primarily within consumer, industrial, energy and financial sectors. At its lowest point during the COVID panic, this more pedestrian, main-street index, fell 56%. That’s not quite as dire as the 85% drawdown by the banks during the Great Recession, but the speedy relief efforts from the Fed and Congress likely forestalled larger declines. For most of the rally from the March lows, this index has underperformed large-cap technology-heavy comparisons, but has caught wind as of late. Over the last week, the S&P Small Cap Pure Value Index (Ticker: RZV) returned 10% while the S&P 500 (Ticker: SPY) returned slightly more than 3%. For the trailing month, this main-street index has rallied 17% compared with 6% for the S&P 500. Will the trend continue? Unclear. But a rally in the most vulnerable small companies does meet the prescription for recovery and offers much more meaningful information on our COVID progress than movements in the S&P 500. If I could have only one indicator to assess the COVID crises…I’d take the RZV.


