The Full Story
The contrast between the market’s returns on Fridays and non-Fridays this year perfectly sums up the dueling perspectives on the coronavirus. Year to date, the Dow Jones Industrial Average has lost a total of 5% on Fridays while gaining a total of 8% on all other days. Remember, markets work tirelessly to calibrate and recalibrate reality with expectations. Over the weekends, economic releases stop, earnings releases stop, and central bankers hit their hammocks. Reality takes a break so to speak, leaving expectations variables like the coronavirus, uncontested. Traders, unwilling to hold positions over periods of asymmetric risk (also known as weekends) flatten their books while buyers simultaneously defer. More sellers than buyers create this natural downforce on fearful Fridays. However, once the week begins, reality and rallies return! Recent reality has mixed encouraging economic, earnings, monetary and fiscal releases with reductions in the coronavirus’s rate of growth. Many economists have attempted to size negative impacts should the virus leap the quarantines, with some projections downright apocalyptic. Anxious times like these increase Google searches and shorten fields of view. Investors who maintain the long view can find comfort in the predictability of returns.

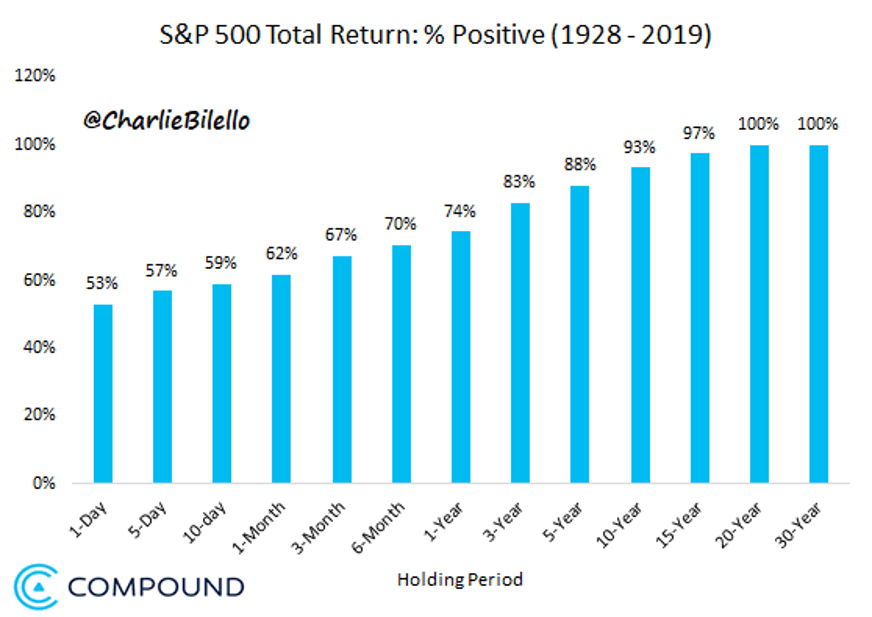
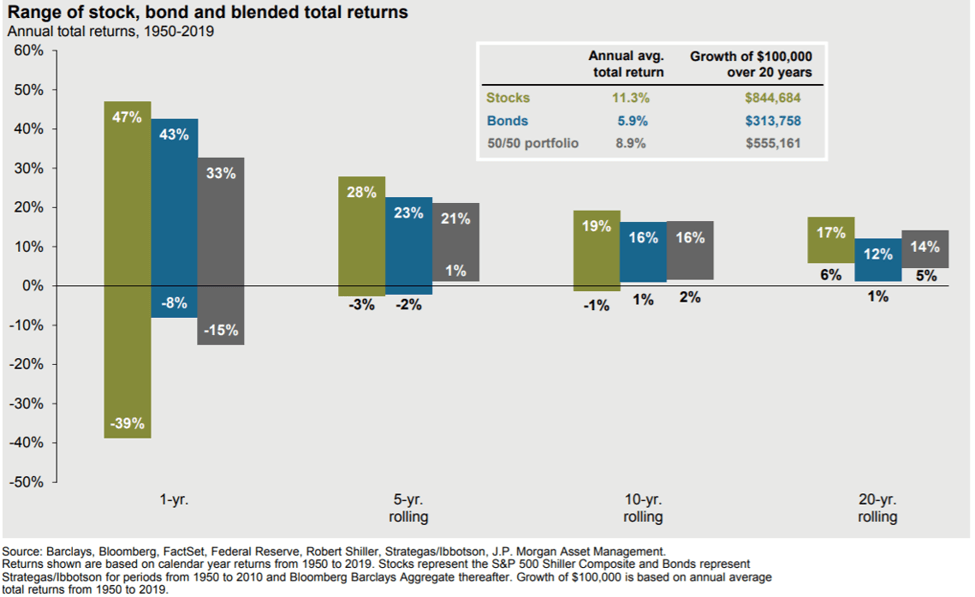
On any one given trading day, the S&P 500 has an even probability of rising or falling. What did the Fed say today? Who tweeted what? What day of the week is it? Expectations vacillate, markets gyrate and it’s a coin toss. If you use daily action for cues on overall market direction, your investment program will surely fail. In fact, if you stop watching the news altogether and make no trading decisions at all, you have a 74% chance of making money in any given year, an 88% chance of making money over 5 years, and a 100% chance of making money over 20 years. Returns vary within these timeframes, but much more so in the near term:

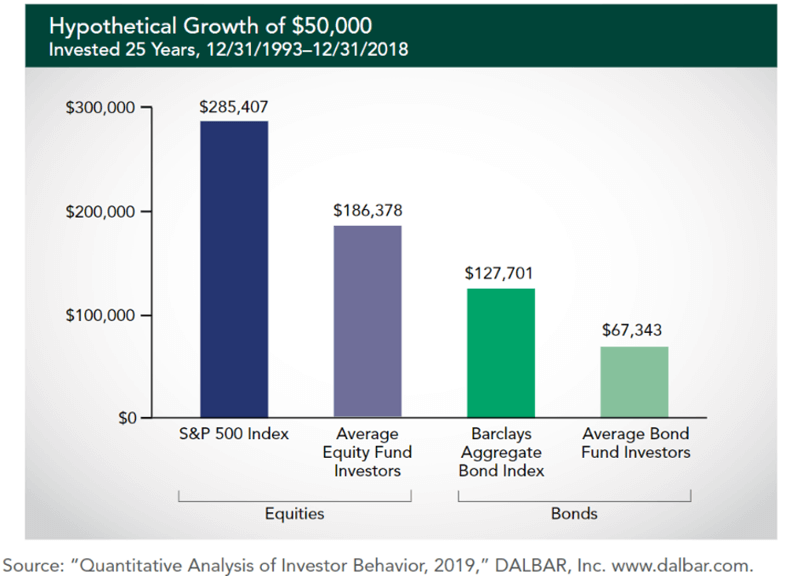
Between 1950 and 2019, the dispersion between the highest and lowest annualized investment returns declines from 86% over the one-year timeframe to 11% over the 20-year timeframe. The 10-year timeframe, which most analysts consider a “full cycle” timeframe, has produced annualized returns of 19% at best and -1% at worst for a high/low dispersion of 20%. If I offered you a 10-year investment with a 93% probability of success and an annual rate of return somewhere between -1% and 19% annually, would you take it? (Say yes…) What if I told you that you could not trade in and out of this investment over the ten years, no matter what? (hmmm…you might not hit that offer…but you should!!) Unfortunately, human desire for control, safety and predictability leads us to act irrationally at times. When it competes with worry, logic often loses. Each year, DALBAR releases a study of actual individual investment returns vs. market returns. From this data we can calculate the cost of worry:

In the example above, $50,000 invested and forgotten within the S&P 500 index between 1993 and 2018 became $285,407. On average, the more active and vigilant mutual fund investors turned $50,000 into $186,378 over the same time period. In total, their worry cost them nearly 200% over 15 years. These models are simplistic and don’t account for taxes, cash flows and life events, but the point is clear: not only is worry a waste of time… it’s also a waste of money!


