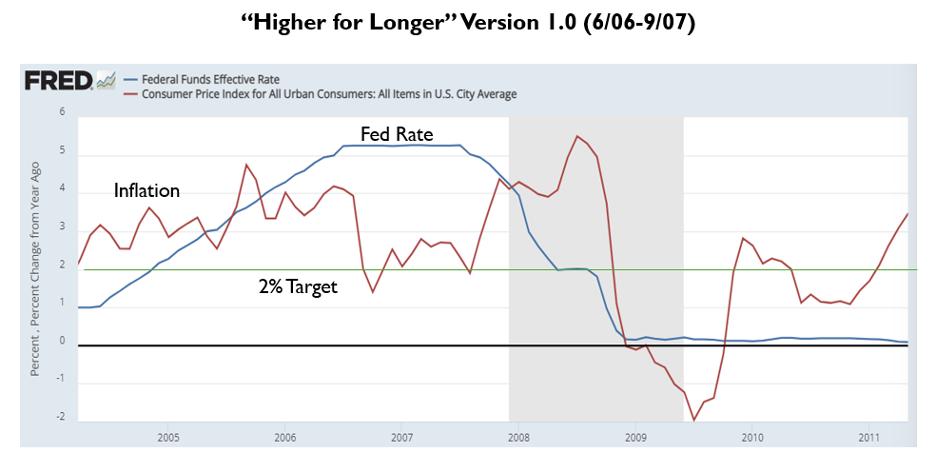
The Federal Reserve’s FOMC meeting results this week were a snooze fest. The Fed has now held rates steady at 5.5% for 12 months. They project only one .25% cut sometime later this year. OK. The longest the Fed has ever held rates “higher for longer” was between June of 2006 and September of 2007, at 5.25%.
Over that period, consumer price inflation fell from 4.1% to 2.3%. The Fed cut rates at that September meeting, not to abandon its steady and noble inflation fight, but to respond to the financial instability fermenting within credit markets.
Ironically, inflation surged following their first rate cut due to a surge in oil prices and a delayed response in owner equivalent rents due to the previous run up in housing prices. The consumer price index hit 5.5% in July of 2008 only to collapse down to -2% by July of 2009. By that point the Fed had cut rates to zero in a breathless attempt to catch up. The last time the Fed hit snooze this long, they got a rude awakening.
It’s not easy running the largest central bank in the world. Ideally, Chair Powell and the Federal Open Market Committee that sets monetary policy would simply divine a mix where unemployment remains perpetually at 4%, while inflation remains perpetually at 2%. Set it and forget it!
Unfortunately, the economy has a few other inputs directing traffic besides Fed policy. How much economic influence does the Fed have? This question seldom gets asked. Based upon the press’s obsession with every official’s latest word, you would expect it to be absolute, but that’s not accurate.
Fiscal policy, geopolitics, weather events, housing trends, pandemics, etc. all have a say in the direction of macroeconomics. Furthermore, each input holds a different weight depending upon the circumstances and degree of force.
The Fed’s Dot Plot
When the Fed emptied the silos during COVID, the economy responded. When the Fed backstopped the banking system with unlimited guarantees after Silicon Valley Bank and First Republic failed, the economy responded. However, these major, influential policy moments followed major influential moments fostered outside the Fed. While they try, the Fed doesn’t really predict the future, they read the present and react to the past.
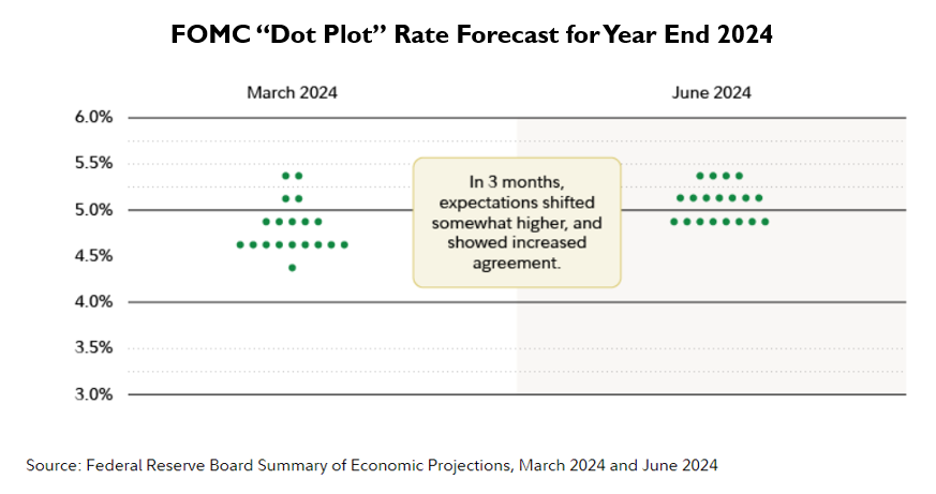
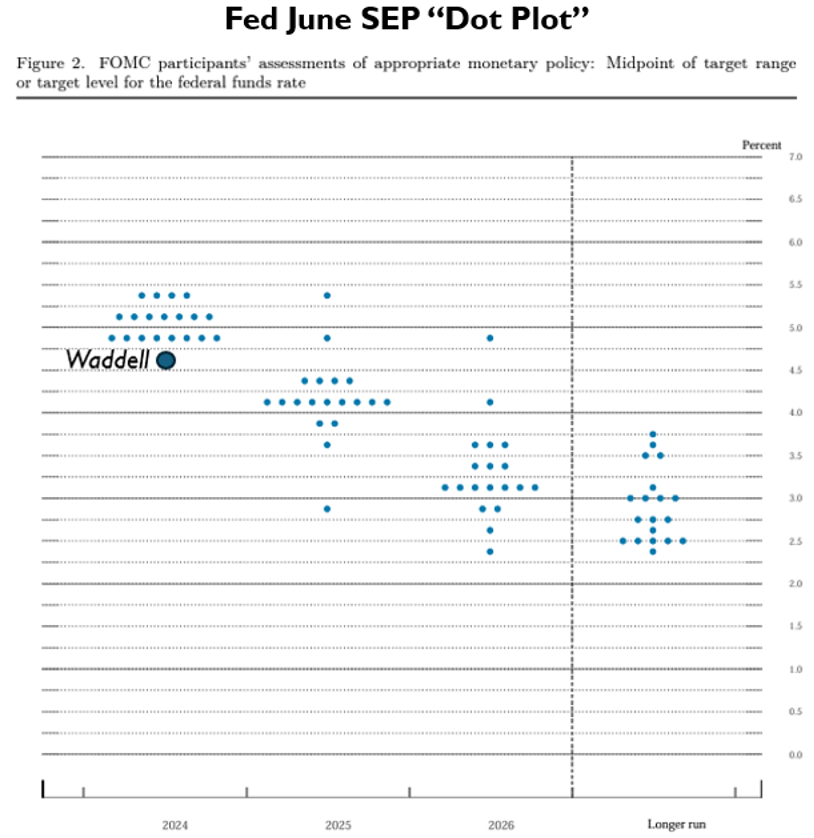
On Wednesday the Fed hardened its “do nothing” stance. The Fed’s Dot Plot, a reading of each member’s Fed Funds rate forecast, eliminated two rate cuts at the median, leaving only one anticipated by year end. Note the consolidation of opinion as we compare the March Dot Plot with the June Dot Plot:
If they cut in September, it will tie their “higher for longer” record, if they wait until December, it will be their longest “higher for longer” streak ever. While I am not suggesting that this inertia invites another Great Financial Crisis, I am suggesting that Fed Funds lingering at 5.5% deserves a bit more scrutiny. So, this week let’s take a deeper look at some key dashboard data, sneak inside the FOMC, and plot our own dot for the Dot Plot.
GDP: Too Hot?
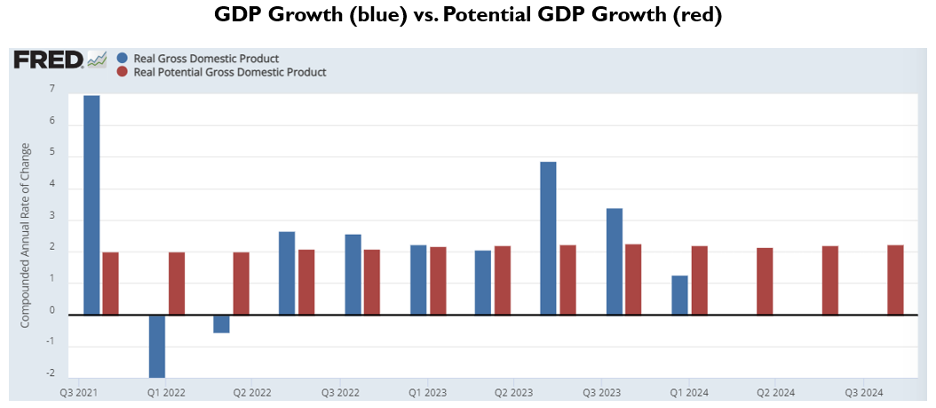
The US economy grew 1.3% in the first quarter. Within the Summary of Economic Projections, the FOMC members forecast a 2.1% GDP growth rate, overall, for 2024 and a 2% GDP growth rate, overall, for 2025 and 2026. With GDP currently running below potential and the Fed forecasting GDP at potential, does the economy appear overheated?
Employment: Too Hot?
The May unemployment report spooked markets when, reportedly, the U.S. economy added 272,000 jobs versus consensus additions of 195,000. This number contains many adjustment factors, some of which will appear in the 2nd and 3rd revisions. So far this year, the initial payroll reports claim that the U.S. has added 1.1 million jobs, but revisions deducted 13% of those jobs.
We shall see the size of revisions that await the May report, but even Powell expressed some doubt over the recent payroll additions at his press conference, stating that there is an “argument that job gains may be a bit overstated.” Furthermore, “We are seeing a gradual cooling in the labor market.” Using another data set, let’s examine a measure Powell has referenced to judge the “balance” within the labor market:
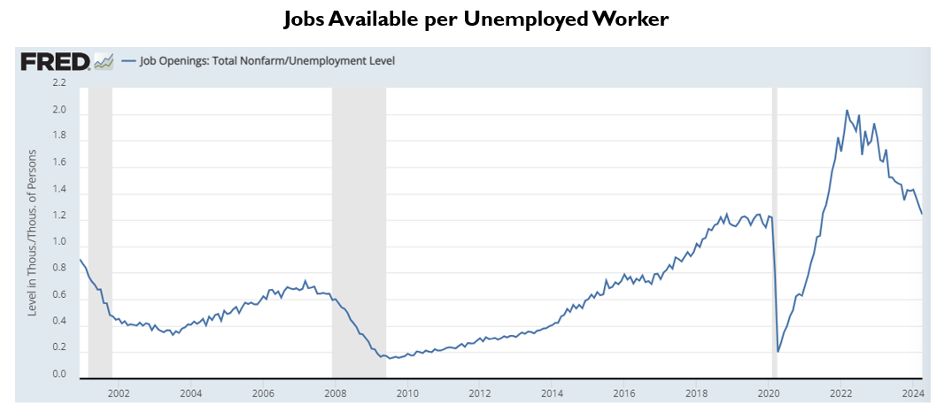
This chart chronicles the number of jobs available for each unemployed worker. The jobs available per unemployed worker averaged 1.2 prior to the pandemic, shot up to 2+ when stimulus stoked labor shortages, and has now returned to 1.2 with clear momentum to the downside. With the unemployment rate up .5% from cycle lows and the amount of job openings per unemployed worker back to pre-COVID levels, does the labor market appear overheated?
Inflation, Too Hot?
The Fed has a 2% inflation target. They reference core PCE as their preferred measure of inflation. Core PCE inflation registered at 2.7% within the April report. 2.7% is more than 2%. For a more recent look at inflation, we received the May CPI inflation report this week. According to that report, consumer price inflation registered at 3.4%, also higher than 2%. However, housing inflation holds substantial influence within each measure (twice as much within CPI as PCE). Things look very different when you eliminate housing inflation from the calculation:
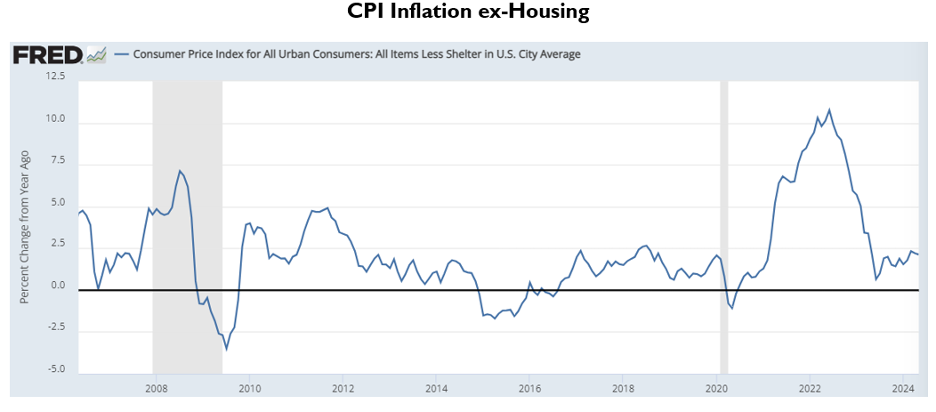
Subtracting housing inflation from CPI results in an inflation rate of 2.1% in May, well within the Fed’s target range. As we know, housing inflation measures lag, given the infrequency with which housing “re-prices.” More recent measures of rent, such as the Apartment List National Rent Index preview, show where lagging CPI and PCE housing measures are headed:
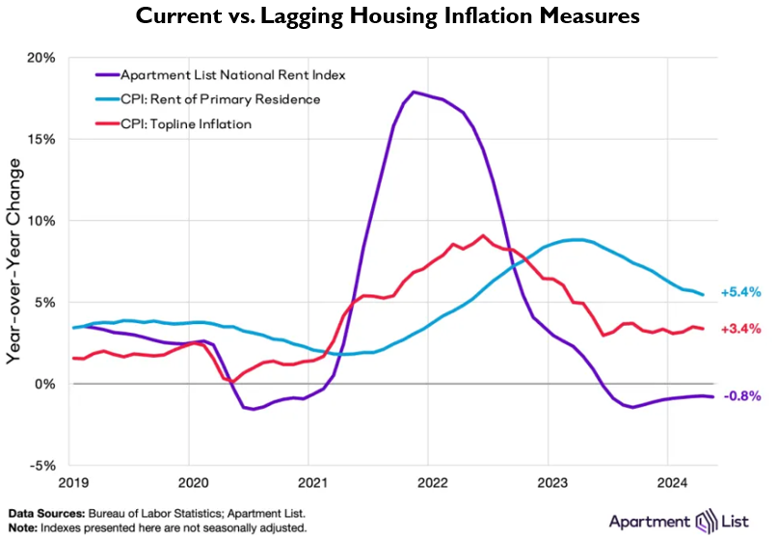
Clearly, listed rent inflation measures peaked well over a year before CPI rent inflation measures peaked. As long as current housing measures remain disinflationary, lagging housing measures will disinflate. With inflation ex-housing levels near the Fed’s target and housing disinflation crawling consistently lower, does inflation appear overheated?
FOMC Me
Taken together, the effective Fed Funds rate, at 5.33%, is now 2.6% above the core PCE inflation rate of 2.7%. That’s pretty tight, and policy gets tighter every month inflation falls further.
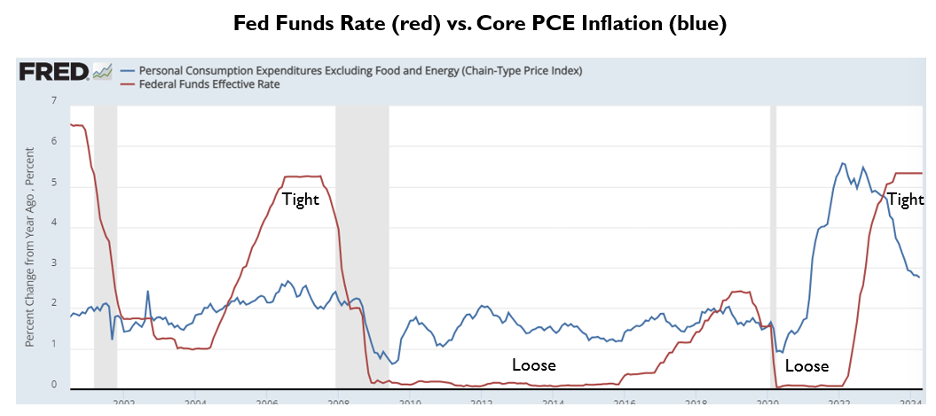
Over the last 40 years, the Fed Funds rate has averaged 1.2% more than the core PCE inflation rate. Applying that policy standard would place the Federal Funds rate 1.4% lower, closer to 4% vs. 5.3% today.
The Fed projected this week that Core PCE inflation will end the year at 2.8%. The April PCE report fell below that at 2.7%. Furthermore, based upon the data we received this week, economists expect Core PCE inflation will cool further to 2.6% in May. That’s .2% below where the Fed expects us to end the year!
Unless housing inflation reaccelerates meaningfully, it’s hard to foresee inflation rising from here. Either the Fed sees something we don’t see, or the Fed must be sleeping. Returning to our role play, given the analysis above, were we members of the FOMC, we would drop our “Dot Plot” dot three cuts lower to end the year, versus the inert FOMC consensus of one. Given Powell’s observable discomfort at the press conference… perhaps he agrees.
Have a great week!
-David
Sources: FRED, The Federal Reserve, Bureau of Labor Statistics, Apartment List