The Full Story:
Democrats surprised the seemingly permanently–surprised pollsters by securing both Senate seats in Georgia on Tuesday. With victory, the Democrats now have control of the House of Representatives, the White House and the Senate. Fear swept across the Twittersphere as talk of granting statehood to DC and Puerto Rico, ending the filibuster rule, and stacking the Supreme Court added adrenaline to the already caffeinated conspiritists. By week’s end, protestors had stormed the Capitol amidst cries for Donald Trump’s impeachment. I heard one breathless broadcaster call it the darkest day in American history. Nonetheless, equity markets rallied smartly to new highs. For those wondering why, I’ll explain!
Less Lockdowns = Less Growth

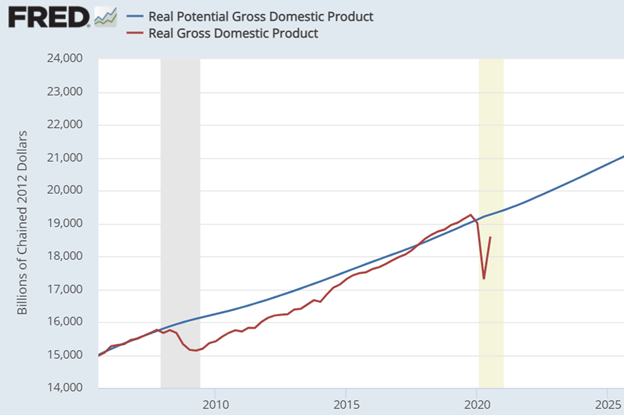
The Federal Reserve uses regression analysis to forecast the potential growth rate of the US economy. The blue line above chronicles their estimates for uninterrupted US economic growth. Unfortunately, US economic growth experiences periodic interruptions (also known as recessions), requiring growth to accelerate above trend to recapture potential. The US economy, as measured by real GDP, hit $19.2 trillion prior to COVID. The COVID divot reduced national GDP to $17.3 trillion. Fortunately, aggressive monetary and fiscal stimulus led to an historic recovery in GDP, and by the end of the third quarter almost 2/3 of what had been lost was recaptured. Analysts expect fourth quarter GDP will rise another 1%, taking GDP up to $18.7 trillion. This still leaves us $500 billion below potential. Therefore, adding together the 2.5% normal growth rate with the 2.5% recovery rate projects a 5% GDP growth rate over the next twelve months to get back on track. If so, we will end 2021 having added another $1 trillion to GDP.
More Deficits = More Growth

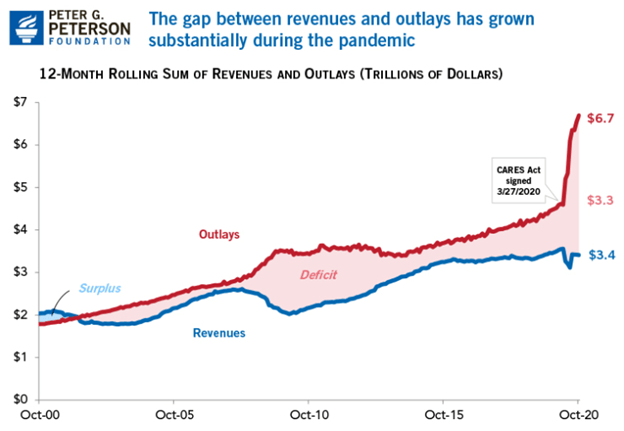
Federal budget deficits stimulate growth because the government injects more money into the economy (spends) than it removes (taxes). Over the last 50 years, federal deficits have averaged around 3% of US GDP. To offset the lockdowns, the US Government ran a fiscal deficit approaching 15% for 2020. Given the additional $900 billion stimulus recently passed, analysts now project a deficit of 10%. However, with the Senate now in hand, Joe Biden may act on campaign promises and add even more stimulus, taking the deficit for 2021 back to 2020 levels. If 2021 matches 2020 levels, the government will spend another $2 trillion above trend.
More Money = More Growth

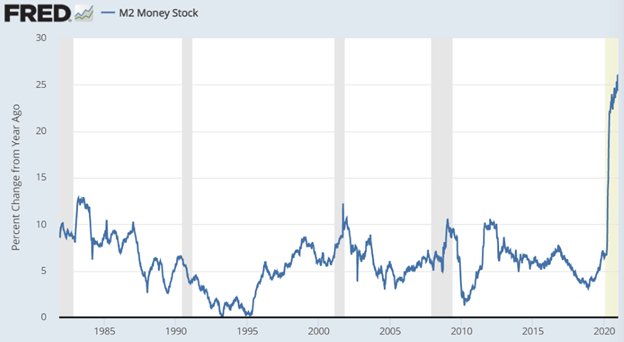
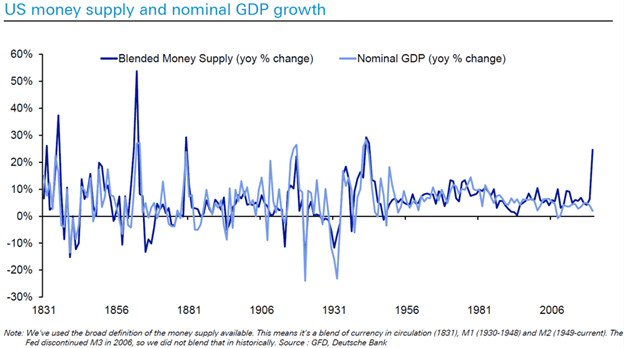
The policy array of the Federal Reserve essentially governs the amount of money (M2) in circulation. Periods of growth–induced inflation concerns (a la the mid 90s) lead the Fed to tighten money supply, while periods of recession–induced deflation concerns (a la the late 2000s) lead the Fed to loosen money supply. Take a hard look at the right hand of the chart above. The Federal Reserve has grown money supply at an annual rate of around 6% over the last 40 years. In 2020, the Federal Reserve grew the money supply 25%. This means that $5 exists today for every $4 that existed at the end of 2019. The Feds haven’t expanded money supply to that degree since WWII. The chart below pairs the growth in money supply with growth in GDP dating back to 1831.

There is a clear historic relationship between the change in money supply and the change in GDP. A 25% surge in money supply will create a surge in GDP should this 200-year relationship hold.


